Dealing with Large Memory Requirements on Android

This article focuses on basic techniques for managing memory usage in applications — such as web browsers, photo editors, and PDF viewers — that have large memory requirements.
First Some Theory
Most apps on Android run on top of Android Runtime (ART), which replaced the now deprecated Dalvik virtual machine. ART and Dalvik are similar to Java Virtual Machine (JVM) in that they share its underlying design principles: They use two separate memory spaces to store application data — stack and heap.
Stack Memory
Java stack memory is used to store local variables (primitive types and references to objects). Each Java thread has its own separate stack. Stack memory is relatively small compared to heap memory. The Java stack size on Dalvik is usually 32 KB for Java code and 1 MB for native (C++/JNI) code. ART introduced a unified stack for both Java and C++ that is around 1 MB.
When an app hits the stack memory limit, StackOverflowError is emitted. The most probable cause for hitting the stack limit is either infinite recursion or an excessively deep method call. Stack memory is always referenced in a LIFO (last in, first out) fashion. Whenever a method call is made, a new block (stack frame) with the method’s local variables is pushed to the stack. When the method completes, its stack frame is popped from the stack and any possible result value is pushed back onto the stack. Infinite recursion or an excessively deep call hierarchy will lead to hitting the stack size limit. The former problem is a bug that can be easily fixed, but the latter needs some refactoring in the form of unwrapping recursive method calls into a cycle.
Heap Memory
Java heap memory is used by the virtual machine to allocate objects. Whenever you create an object, it’s always created in the heap. Virtual machines, like JVM or ART, perform regular garbage collection (GC), making the heap memory of all objects that are not referenced anymore available for future allocations.
To provide a smooth user experience, Android sets a hard limit on the heap size for each running application. The heap size limit varies among devices and is based on how much RAM a device has. If your app hits this heap limit and tries to allocate more memory, it will receive an OutOfMemoryError and will terminate. So let’s look at some of the techniques for preventing this situation.
Analyzing Heap Memory
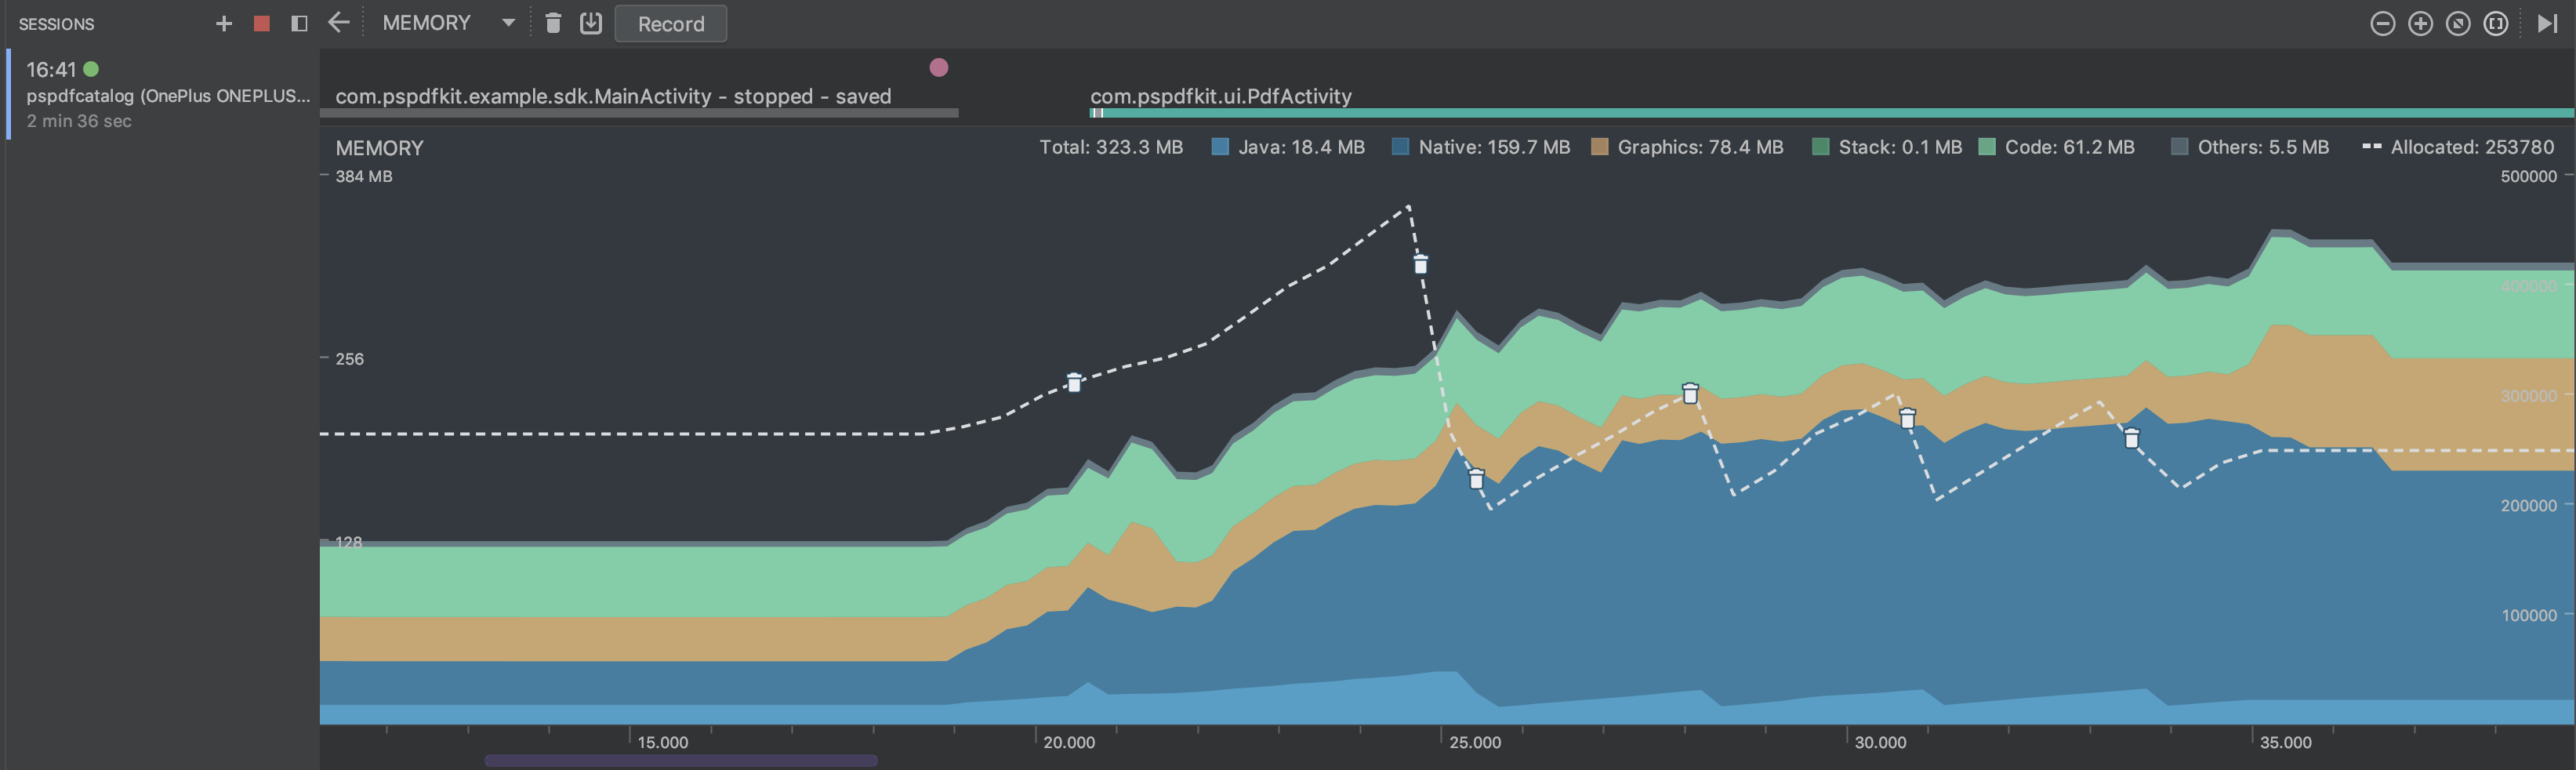
The most important tool for investigating memory problems in your apps and for understanding how the memory is used is the Memory Profiler available in Android Studio.
This tool provides visualization for how much memory your app takes over time. You can take snapshots of the running app’s Java heap, record memory allocations, and inspect the heap or recorded memory allocations in a powerful UI.
Your typical memory profiler session should look like this:
-
Look for frequent memory allocations and garbage collector runs to detect possible performance issues.
-
Look for memory usage over time, especially after operations that are known to require a lot of memory allocation. Make sure that memory usage goes down after these operations are done. For example, below you can see the memory impact of PSPDFKit’s
PdfActivityafter loading a document.
-
Dump the heap at multiple points of your app runtime to inspect your memory usage. Look for large objects that are kept in memory and prevented from being garbage collected. Heap dumps can also help identify memory leaks — for example, you can search for your activities in the heap dump to see if the old instances have been collected.
Here at PSPDFKit, we use the memory profiler extensively to spot memory usage issues while working with complex documents. We also use it regularly to get a quick idea of how big of a memory hit we are introducing with our new features or various refactorings (we always balance memory usage and performance).
Memory Leaks
Today’s garbage collectors are complex pieces of state-of-the-art technology — the result of many years of research and development from countless people ranging from academics to development professionals. However, we still need to take care to avoid introducing memory leaks.
The industry standard for detecting memory leaks is the LeakCanary library. It automatically shows notifications when a memory leak is detected in your development builds, providing you with a stack trace of the leak in its UI. You can (and should) easily integrate it today!
Introducing new memory leaks is especially easy when working with complex lifecycles of Android activities or fragments. It’s a common occurrence in places where developers hold strong references to UI Contexts or other UI-specific objects in a background task or in their static variables. One of the ways to trigger these leaks is to rotate your device multiple times while testing your app.
Release Memory in Response to Events
Android can reclaim memory of your app or outright kill your app when it’s necessary to free memory for more critical tasks. Before this happens, the system gives you a chance to release any memory you don’t need. You’ll need to implement the ComponentCallbacks2 interface in your activity. Then, whenever the system is under memory pressure, you’ll receive a call to the onTrimMemory() method and can release memory or disable features that won’t work in such low-memory situations.
PSPDFKit also handles these callbacks. We designed PSPDFKit to use a lot of memory for caching so we can make things more fluid. We don’t know how much memory is available on a device, so PSPDFKit will adapt and restrict usage when we get low-memory notifications. This makes it possible to run PSPDFKit-powered apps even on low-end devices, albeit with worse performance due to disabled caching.
Large Heap
One immediate solution for dealing with large memory requirements is to request a large Dalvik heap for your app. You can do this by adding android:largeHeap="true" to your <application> tag in AndroidManifest.xml
If the largeHeap property is set to true, Android will create all processes for your application with a large heap. This setting is only intended for apps that can’t work without it due to their nature, i.e. they are using large resources that need to fit into memory at the same time. It is strongly advised that you don’t use a large heap just to allow higher memory usage. You should always optimize your memory usage, because a large heap on low-memory, low-end devices can still be too small for your application.
Checking How Much Memory Your App Can Use
It’s always a good idea to check how big the heap of your app is and dynamically adapt your code and available features to these memory limits. You can check the maximum heap size at runtime by using the methods getMemoryClass() or getLargeMemoryClass() (when a large heap is enabled).
Android supports devices with as little as 512 MB of RAM. Make sure you remember low-end devices too! You can check whether your app is running on a low-memory device via the isLowRamDevice() method. The exact behavior of this method depends on the device, but it usually returns true on devices with less than 1 GB of RAM. You should make sure that your app works correctly on these devices and disable any features with large memory usage.
You can read more details about how Android behaves on low-memory devices, as well as some additional memory optimization tips for them, here.
Use Optimized Data Structures
In many cases, applications use too much memory simply because they use suboptimal data structures.
Java collections can’t store efficient primitive types and require boxing for their keys or values. For example, HashMap with integer keys should be replaced with the optimized SparseArray. Ultimately, you can always use raw arrays instead of collections, which is a great idea when your collection does not resize.
Other memory-inefficient data structures include various serializations. While it’s true that XML or JSON formats are easy to use, using a more efficient binary format such as protocol buffers will lead to lower memory usage.
These examples of memory-optimized data structures are meant only as a hint. As with all refactorings, you should first find the source of your problems before proceeding with these performance optimizations.
Prevent Memory Churn
Java/Android virtual machines allocate objects very quickly. Garbage collection is pretty fast too. However, allocating a large number of objects in a small time slice could lead to a problem called memory churn. In such a case, the virtual machine and garbage collector can’t sustain such frequent allocations and the application slows down or, in extreme cases, gets into an out-of-memory situation.
The main problem for us in Android land is that we have no control over when the GC is performed. This can potentially lead to performance problems — for example, if the GC runs during a UI animation and we miss the 16 ms threshold for smooth frame rendering. Thus it is important to prevent excessive allocations in our code.
One example of a situation that leads to memory churn is allocating large objects such as Paint inside the onDraw() method of a view. This creates many objects quickly and could lead to garbage collection that can negatively impact the performance of the view. You should always take care to monitor your memory usage to prevent these situations.
Optimizing PSPDFKit’s Memory Usage
Here at PSPDFKit, we’ve built an SDK that can deal with very complex documents. Since rendering PDFs is a memory-consuming task, we need to be extra careful in making sure apps using PSPDFKit won’t hit Android’s memory limits, which will result in the app being killed by the OS.
We have an extensive guide that lists most of the tricks described in this article in the context of PSPDFKit-powered apps. If you are integrating PSPDFKit, I strongly recommend you take a look at it.
Conclusion
Random-access memory (RAM) can be rather constrained on mobile devices. Making sure that you are using it efficiently is especially important while building apps that work with bigger objects such as large bitmaps (PDF viewers, web browsers, photo editors) or large media files (audio or video editors). Tips from this article are a must for every developer who wishes to build quality apps with acceptable behavior, even on low-memory devices.
I hope that you won’t see any memory-related crashes in your apps. Happy coding!

Tomáš has a deep interest in building (and breaking) stuff both in the digital and physical world. In his spare time, you’ll find him relaxing off the grid, cooking good food, playing board games, and discussing science and philosophy.