The Subtle Art of Real-Time Debugging With Android Studio


If debugging is the process of removing software bugs, then programming must be the process of putting them in.
Edsger Dijkstra
It sometimes happens that even when you come up with all possible countermeasures, your software has bugs. You took all the precautions — you did TDD, code review, pair programming, and manual testing — but in the end, it’s the same old story: there’s a bug, and you have to start debugging to track it down and fix it.
This blog post will show some advanced features in Android Studio that will help you debug your application faster, in real time, thereby cutting down on the work and avoiding the need to recompile.
Log, Log, Log
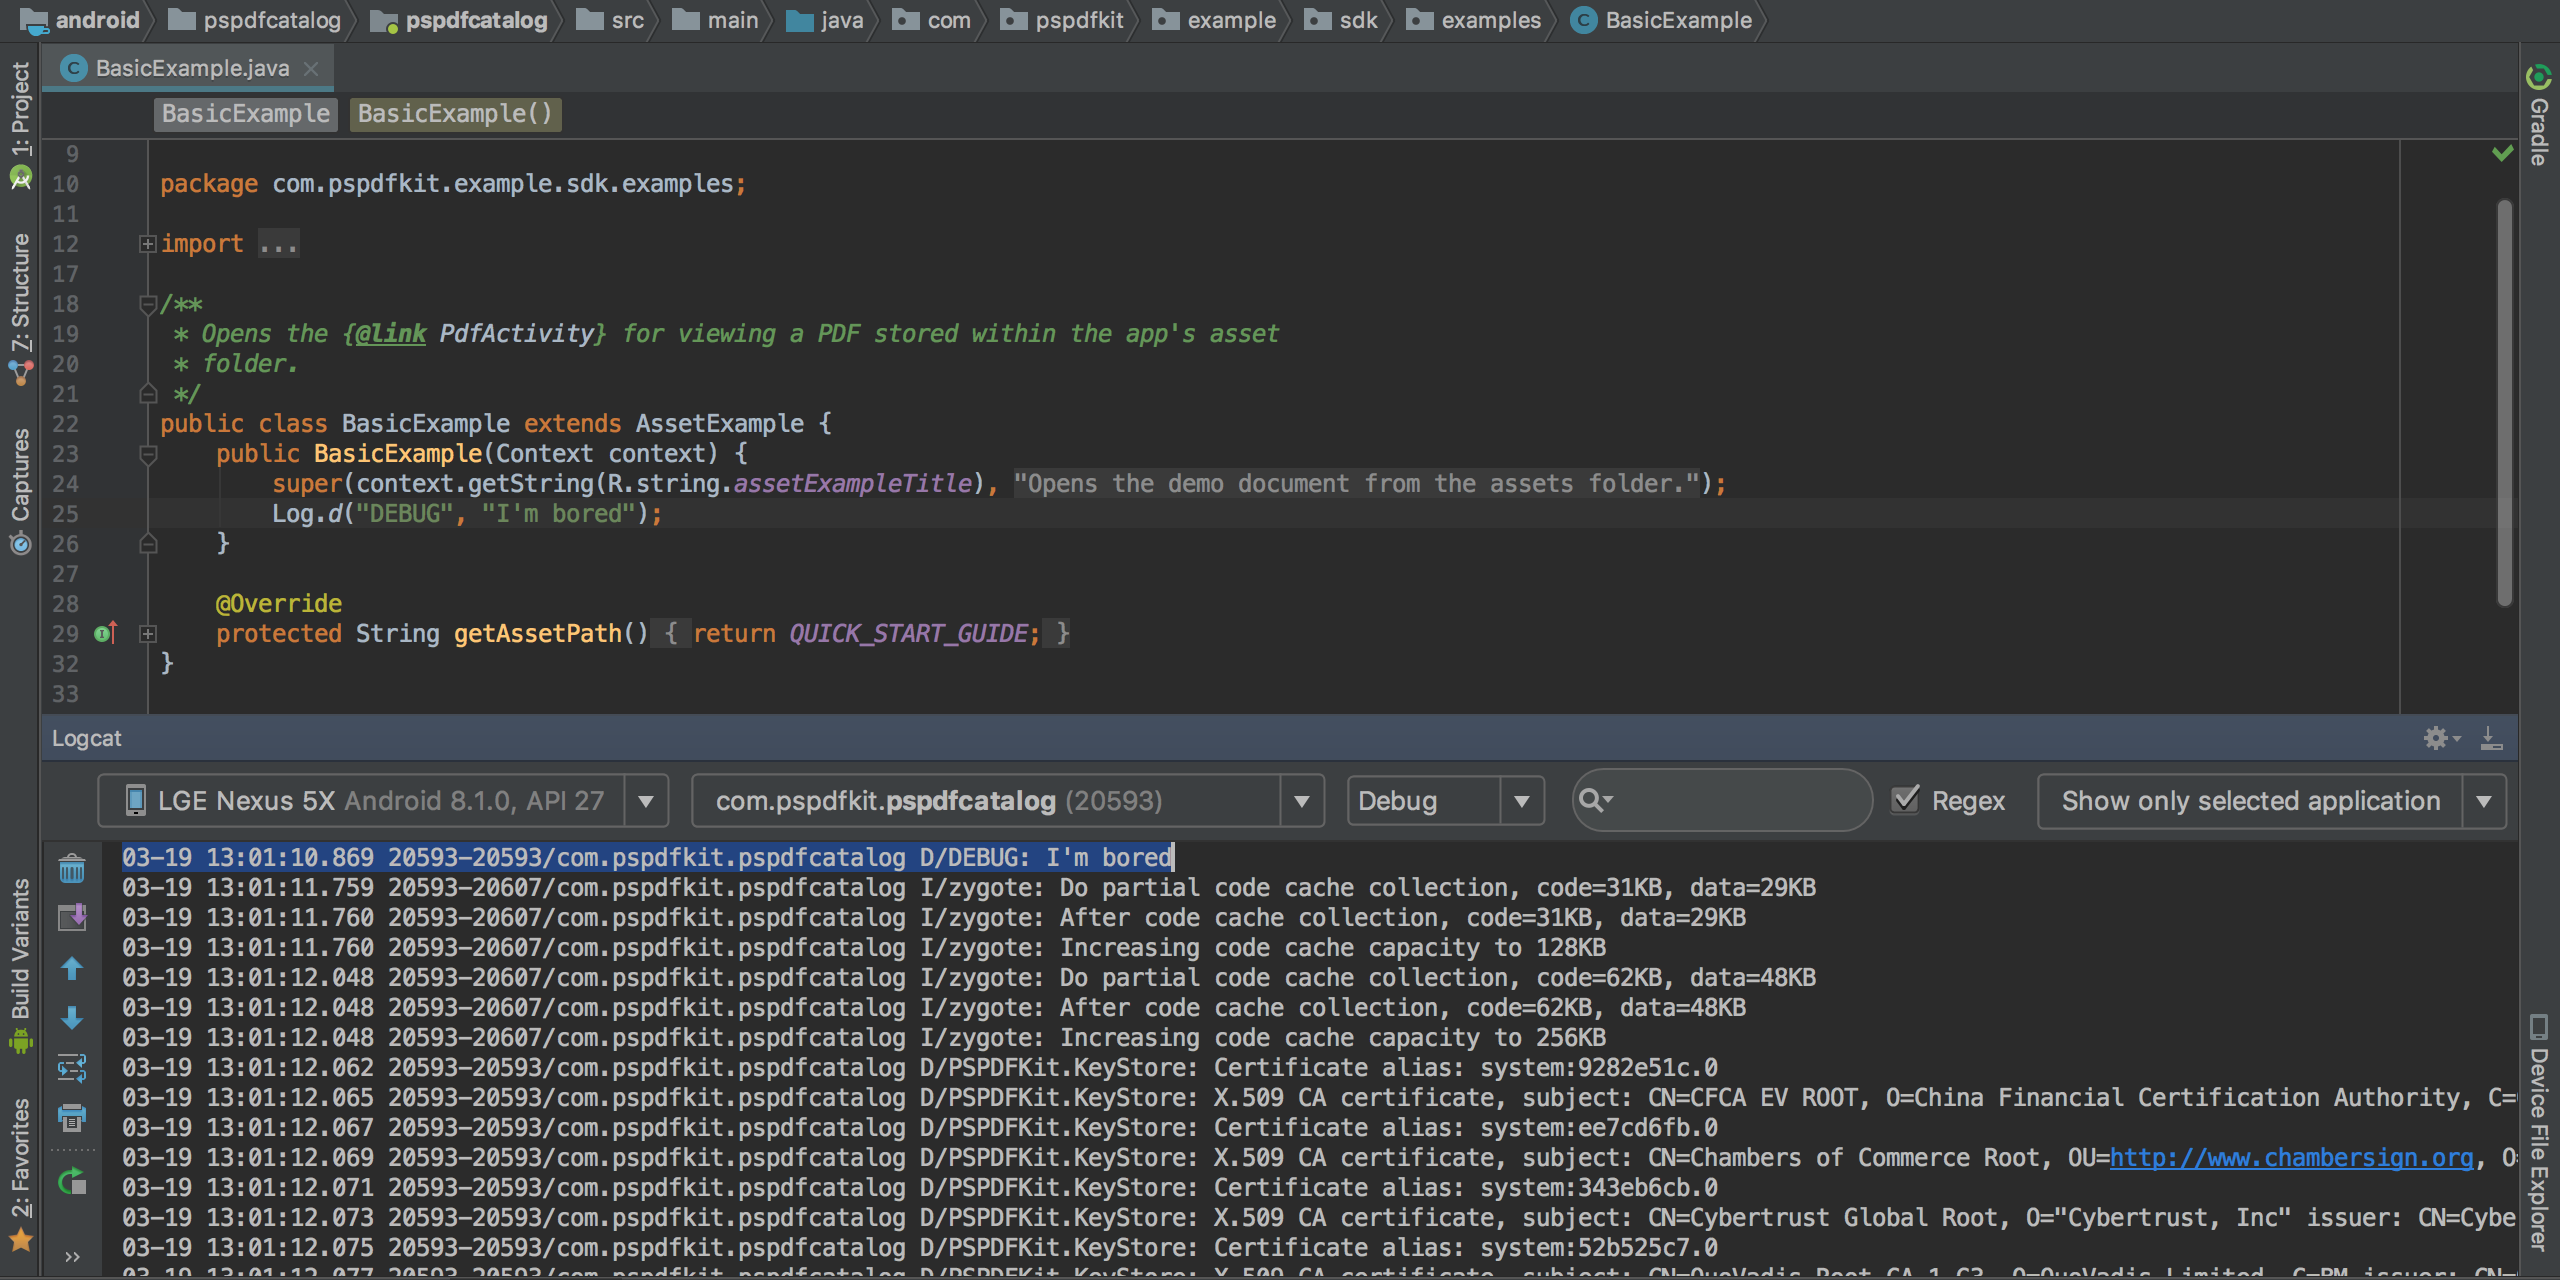
A common operation for understanding the code flow and detecting any discrepancies that may be the cause of a bug is to add some log lines and recompile your project while watching the outcome in the Logcat tab of Android Studio. But it’s a boring and tedious process, and every time a new log is required, the app needs to be compiled again.
So what if I told you that you can have all of this for free without recompiling and rerunning the app every time?
Go to the line you want to log and add a breakpoint. Then right-click on the red dot of the breakpoint and deselect the Suspend checkbox. A more detailed view should suddenly open and let you select Log message to console.
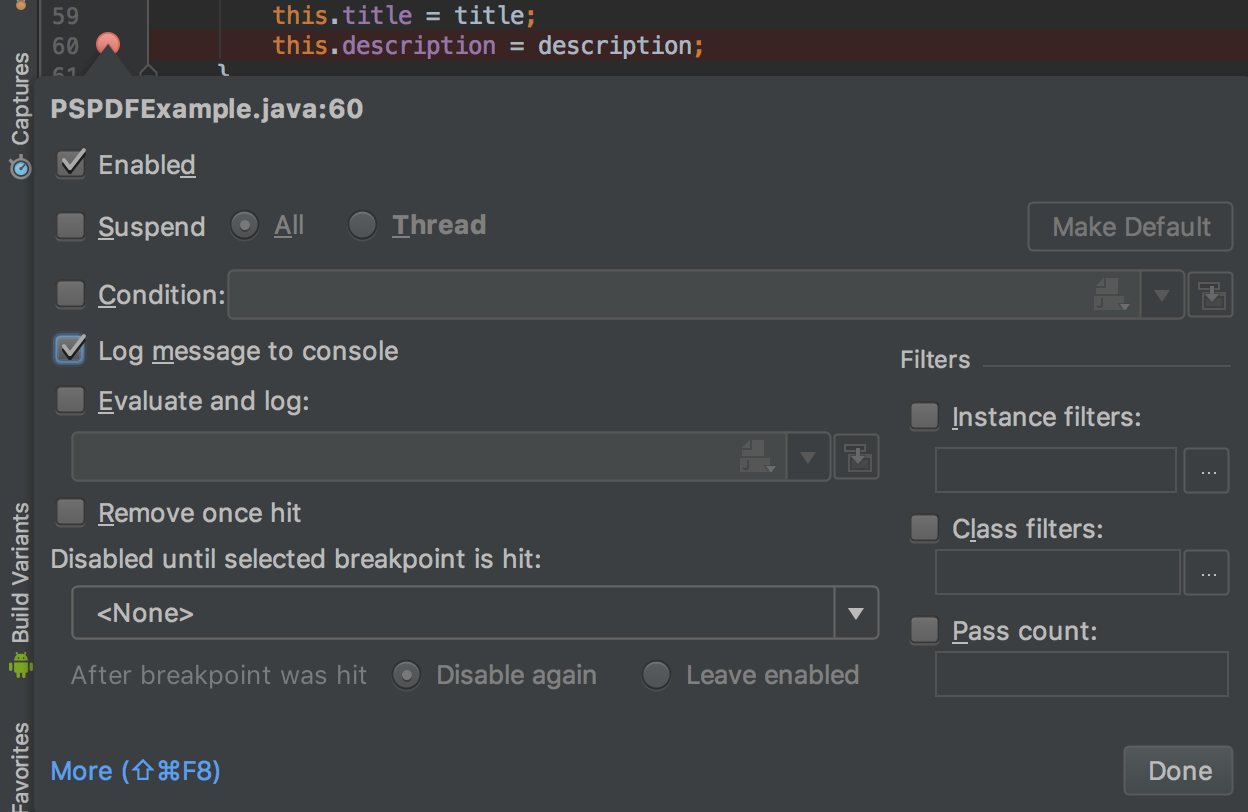
To effectively start the logging process, select Attach debugger to Android process. This will trigger the log every time the computation passes through the selected line.
Once this is done, the application will be in debugging mode. Now more lines can be logged using the same procedure, and the changes will be reflected in real time.
Advanced Logging Operations
There are also some options for advanced operations, which are very handy when scrolling loops or for checking if a particular condition is satisfied:
-
Remove once hit — This will log the line only once and is useful for detecting if the code flow is entered correctly in a
forloop. -
Condition — This will let you choose between Java and Kotlin, and it will log the line only when a certain condition is met.
-
Evaluate and log — As the name suggests, this will evaluate a certain value and print it out to the console, together with the line number.
Without the hassle of recompiling and rerunning the app every time, following the computation and printing out logs will be much faster, and it will literally take a couple of clicks to put you on the right track to fix a bug.
Do It Once, Faster
Debugging code will be always an important step of the workflow, and being able to streamline it will save you time. And when working on legacy code, debugging will become even more important. For more information on this topic, check out the most mentioned book on Stack Overflow — Working Effectively with Legacy Code by Michael C. Feathers — and read about our tricks for efficiently navigating around new code.
Happy debugging! 😀