NDK Debugging

At PSPDFKit, we work with a very large C++ codebase that is shared between our various platforms — the PDF specification is large, and there are many edge cases that need special treatment. On Android, we use the Native Development Kit (NDK) to compile our codebase into a shared library (libpspdfkit.so) that handles most of our business logic.
Sometimes our C++ code does not behave as it should on Android. Until recently, we used logs to understand complex flows in our code. However, this was a labor-intensive process, and it required recompiles of the app whenever a new log was added. As you might imagine, this got tiresome quickly, so we spent some time experimenting with various ways of debugging our NDK code via the C++ debugger. I’ll present some of our findings in this article.
Note that our primary platform for development is macOS, and the steps we outline in this article have only been tested on macOS. We’ll use the LLDB C++ debugger, as it’s the preferred option for macOS users, and it is also used by NDK. Using the same approach on other platforms and/or debuggers should work in a similar fashion, but this is left for you to discover.
Debugging Android Applications
Android Studio provides basic C++ debugging capabilities with full support for the LLDB debugger. C++ debugging works out of the box in Android Studio when using native build integration in the Android Gradle Plugin. See this information about integrating a C++ build with Gradle for more details.
However, this integration doesn’t work with our setup, as we use a custom CMake build for our native libraries. Thankfully, this is easily fixable by pointing Android Studio to the proper debugging symbols, as shown below.
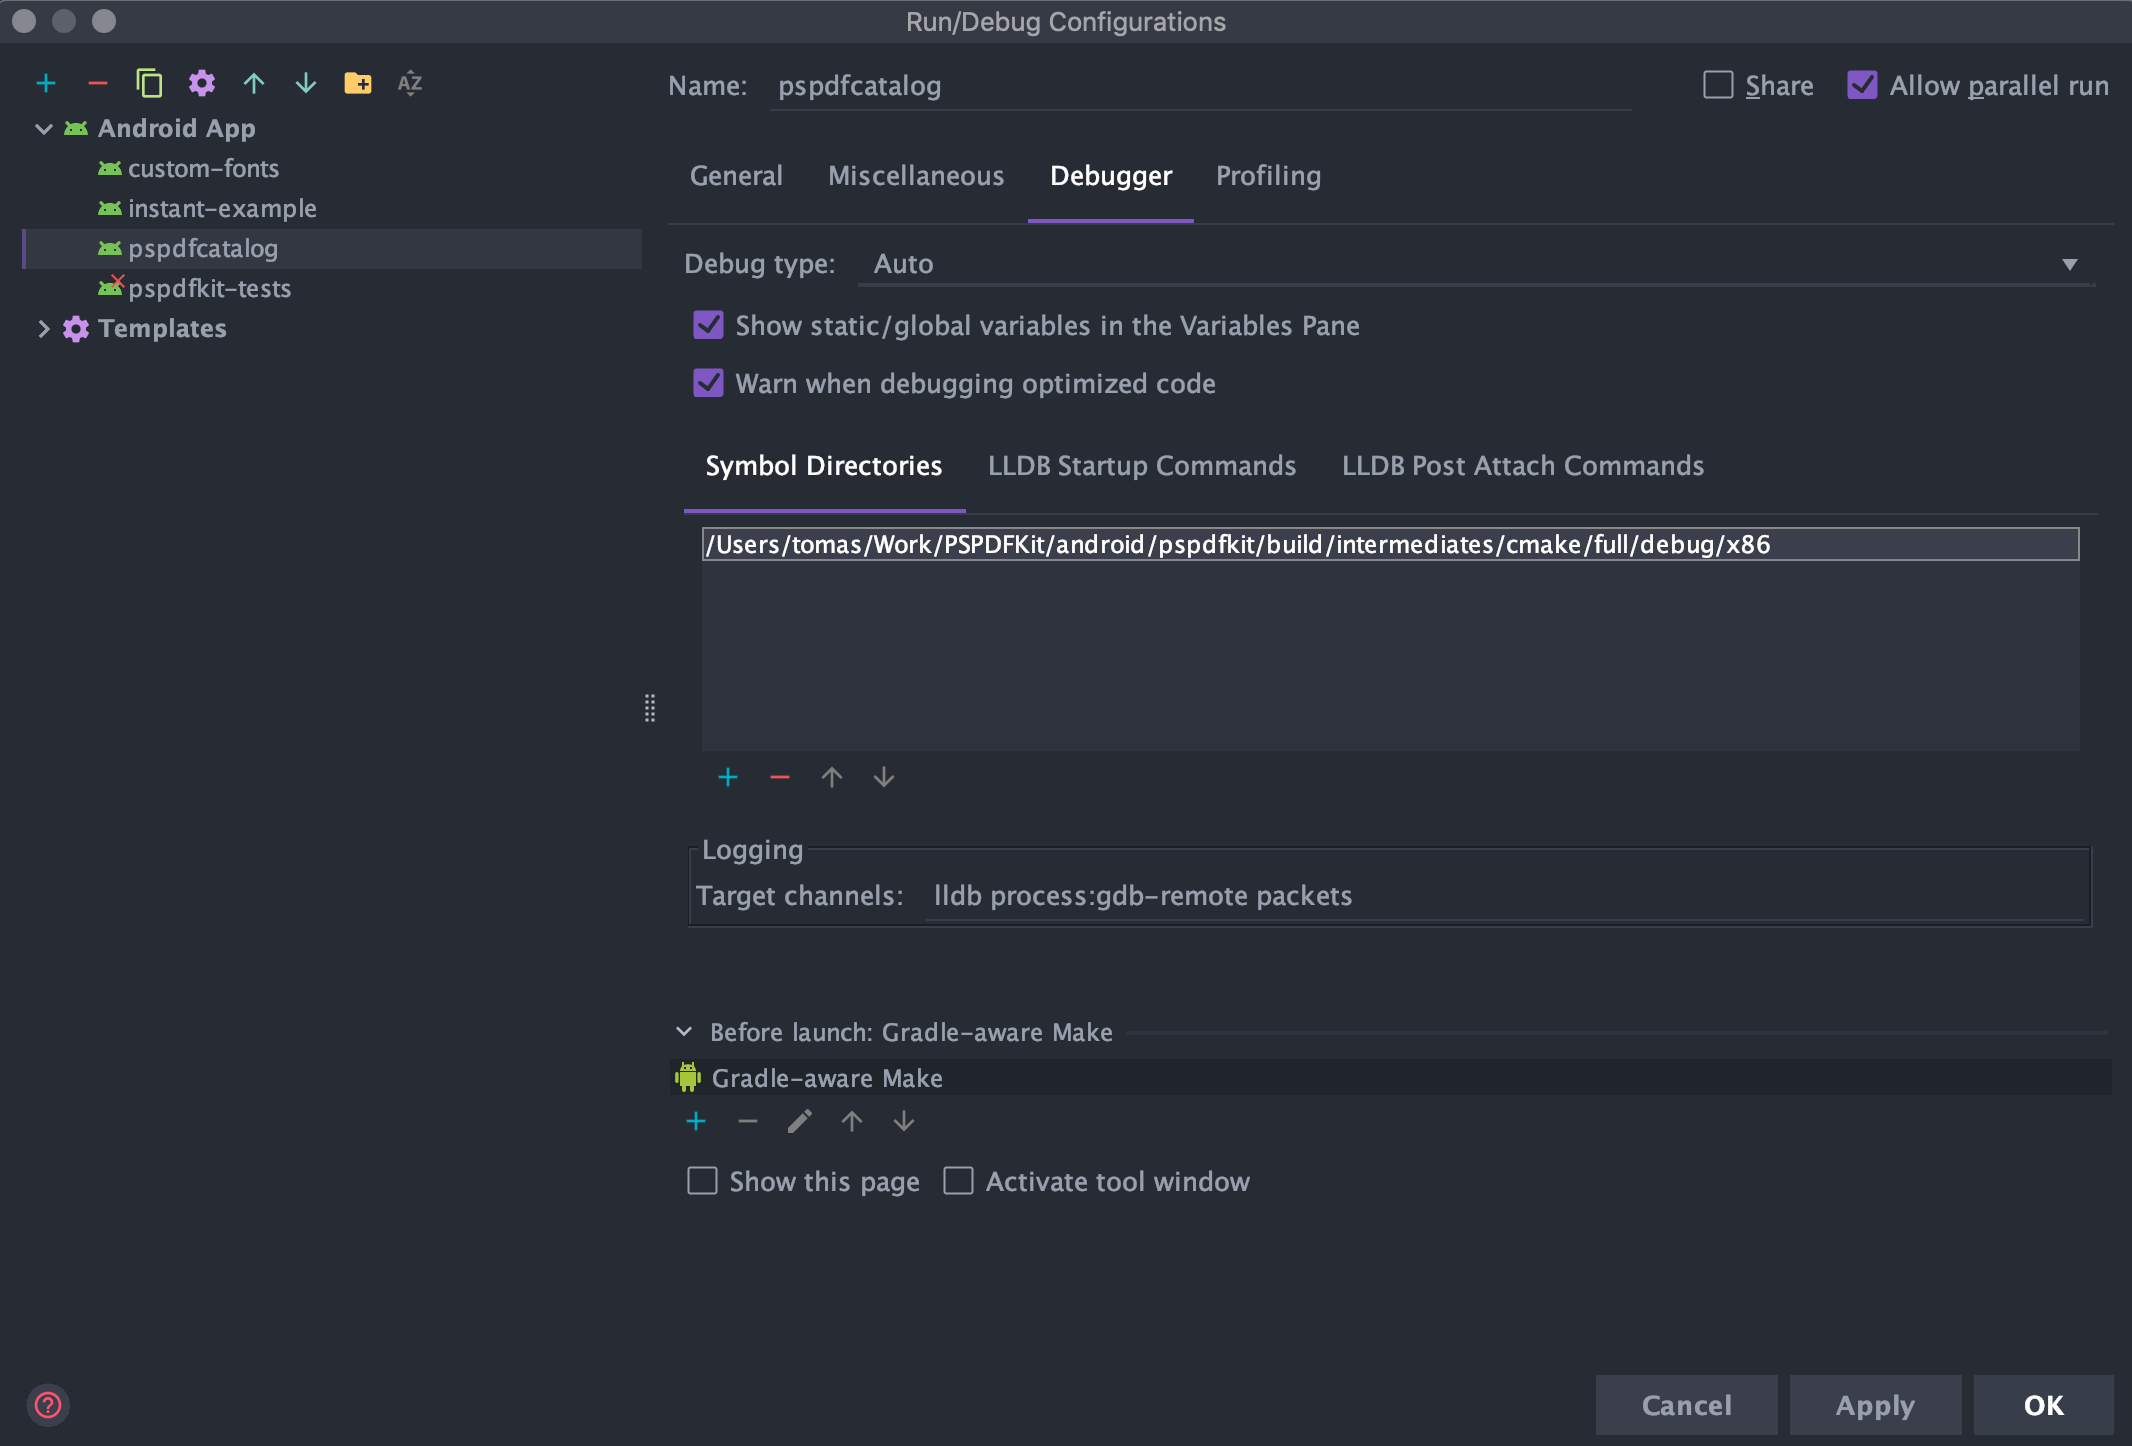
The same technique can be used to debug your instrumentation tests: just set up their run configuration to have access to your native library debugging symbols.
Debugging Android Unit Tests
We have an extensive suite of JUnit unit tests sprinkled with some Robolectric (for more on this, see the Rendering Tests Using Robolectric blog post). Android Studio does not support local C++ debugging (in our case, on macOS) so we initially had no way to debug our C++ code in these tests without porting them to instrumentation tests first.
In addition, debugging Android applications or instrumentation tests has some major stability issues that stem from the fact that the debugger runs through ADB via the TCP/IP channel. This leads to a frustrating debugging experience, wherein the debugger misses breakpoints or outright disconnects from the debugged process.
However, we quickly realized that because our unit tests are running on the local machine, it means that attaching the C++ debugger to their processes should be possible.
Compiling C++ Libraries for macOS
The first step in making it possible to debug your native C++ library in local unit tests is by loading your library in them. Understandably, it is not possible to load shared libraries compiled for Android on JVM tests running on macOS, as macOS uses a different executable format (.dylib). Compiling our shared library for macOS has been fairly simple, because it has always been written in modern C++ with portability in mind. We just had to slightly adapt our CMake configuration to target macOS. The exact steps are outside of the scope of this article, so we’ll skip them here.
Attaching the Debugger to the Local Process
Attaching the debugger to the local process is fairly straightforward and does not differ from debugging any other macOS application. The only difference is that the various Java processes are indistinguishable in the process manager (be it Activity Monitor or console tools like htop).
The steps for attaching LLDB to the unit test running on the local machine were simple.
-
Run the JUnit test and make it stop at a breakpoint in Java.
-
Run the
jpscommand in the terminal:
$ jps
17691 GradleDaemon
25595 JUnitStarter
4939
17854 KotlinCompileDaemon
-
Copy the PID (first column) of the
JUnitStarterprocess. -
Attach the LLDB debugger to this process.
Choosing the Debugger Environment
You are free to use LLDB in a way that is most natural to you.
First, if you find it most productive, you can use LLDB from the terminal. LLDB can be attached to an existing process via a single command:
$ lldb -p pid
It’s always an option to use your favorite text editor. Visual Studio Code, Vim, Emacs, and others have plugins that bring support for LLDB, but you can easily search for whatever fits your specific needs. After your editor is set up, just attach the debugger to the JUnitStarted process.
Finally, the most fully featured solution is to use a C++ IDE. In our experience, CLion and Xcode work great. In both cases, you’ll need to create projects with all your sources.
Where to Go from Here
Having a fully featured debugger is an important tool in any developer’s toolbox. That said, I hope I’ve shed some light on how to enable C++ debugging for your Android project. For more information about Android C++ support, check out Add C and C++ code to Your project in the Android Developers guide. You can also read more about LLDB and CMake on their respective sites.
Good luck with your debugging!

