Async Stacktraces in Android Studio
 David Schreiber-Ranner
When developing software with Java and Kotlin, you will likely use a lot of threading. For example, Android apps use a “main thread” for executing user interface code, forcing developers to offload longer-running tasks to background threads in order to keep the UI responsive. Just like any other code, your asynchronously executed code will have bugs (unless your name is Chuck Norris) that need to be fixed through debugging.
Often when debugging asynchronous code, you will look at a line of code and think: “Who called this method?” or “Where was this async call enqueued?” You’ll probably know how this call was enqueued.
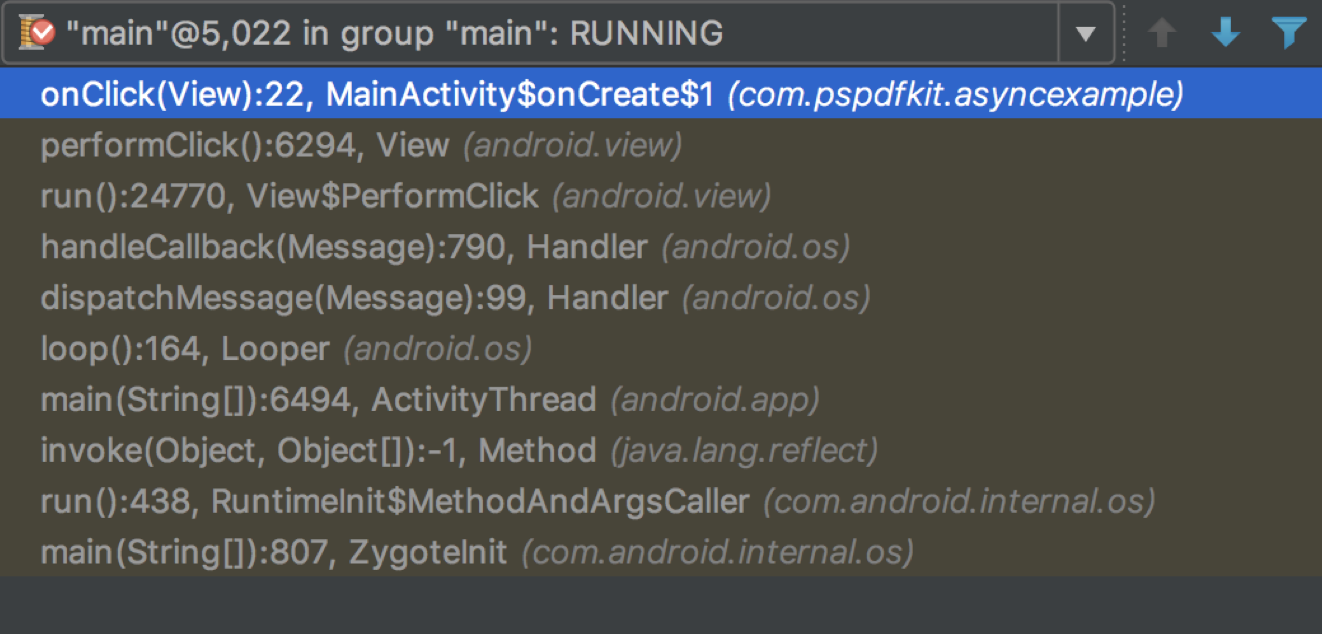
The stacktrace above is the result of a simple button click. You can easily spot the name of the activity (MainActivity) and the line number inside the callback method. However, you can’t find out where the called OnClickListener was registered on the button just from looking at the frames. For a click listener, it might be easy to find out by simply navigating to the callback method in code (unless you pass around listeners like crazy).
However, for larger scale async code, it might be more complicated to find the execution path.
A Real-World Example
Of course, we all write sophisticated code, so let’s look at an elaborate example of this:
fun origin1() {
    // ... does some weird stuff.
    importantMethod()
}

fun origin2() {
	// ... does even weirder stuff.
    importantMethod()
}

/** This is an important method! */
fun importantMethod() = Completable.complete()
    .subscribeOn(Schedulers.computation())
    .subscribe {
        if (isInWeirdState()) {
	        // TODO: Handle weird state.
		    throw IllegalStateException("I am a bug! 🐛")
	     }
    }
If you write code like this, you will soon notice that it doesn’t behave as expected. You will use the debugger to find the cause, tracing the issue down to a bug (have you already spotted it?) that only happens in some code paths. Below is the stacktrace you will find inside your IDE.
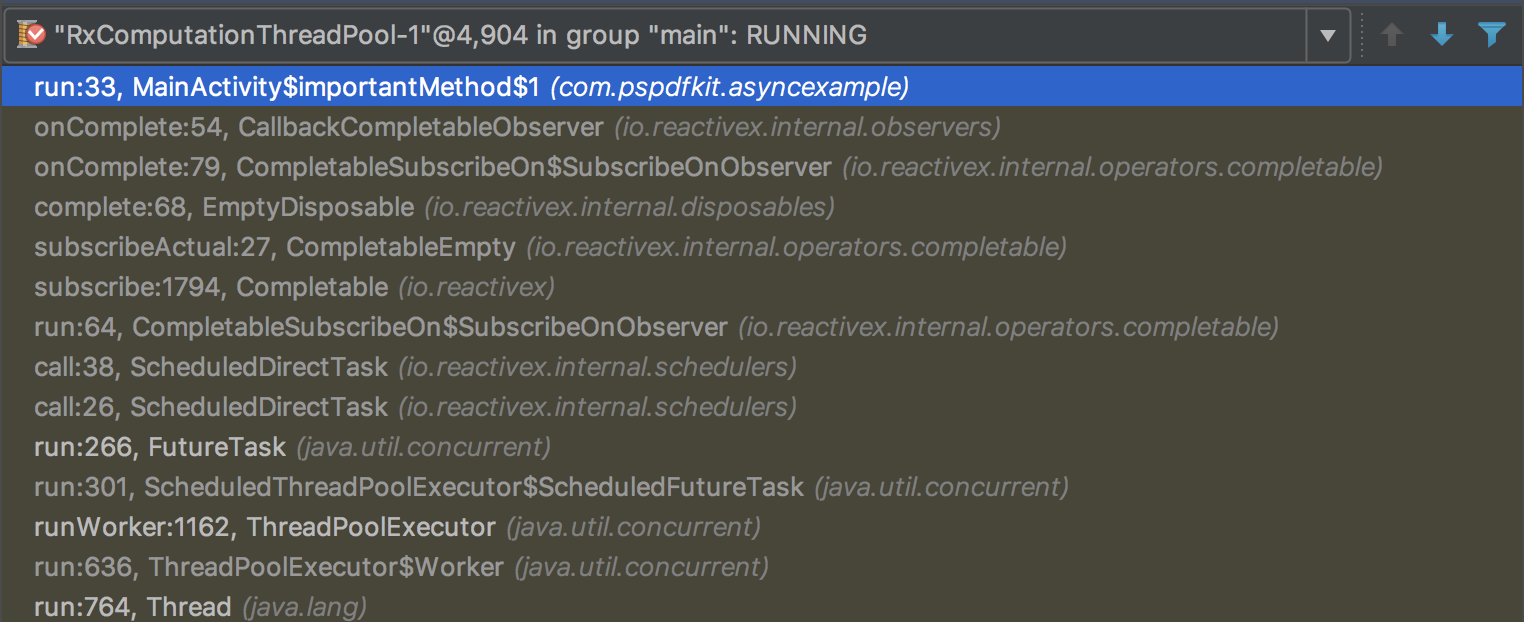
From the stacktrace, you won’t be able to infer which of the two methods, origin1() or origin2(), was the original source — the stacktrace looks exactly the same for both methods. To find out where in your code things went wrong, you have two options:
-
Attach two more breakpoints — one inside
origin1()and the other insideorigin2()— to see which method is on the execution path. -
Make your stacktraces async. (What?!) Yeah.
Async Stacktraces to the Rescue
There’s a little-known feature of IntelliJ IDEA (and also Android Studio) called “async stacktraces.” The official documentation on async stacktraces reads like a haiku:
Capture point in the code,
Insertion,
Was this helpful?
The second resource you will find on this feature is the launch blog post of IntelliJ EAP 2017.1. At the time it was written, async stacktraces had pretty much the same feature set they have right now, but everything was named a bit differently.
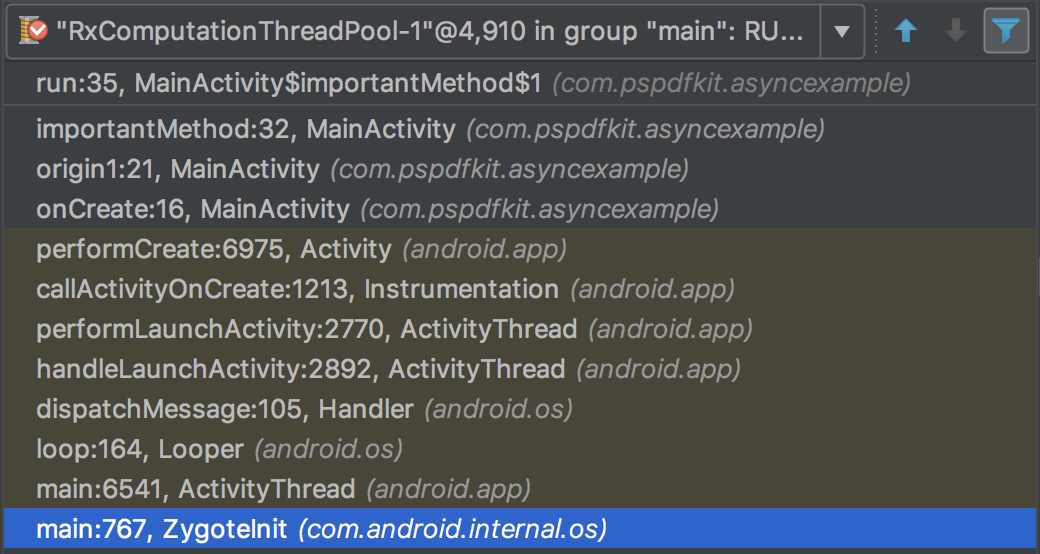
Even with that limited amount of information, it is possible to figure out how async stacktraces work — I spent a couple of minutes (hours) in a trial and error approach to wrap my head around it. Once everything is set up, your IDE will produce stacktraces like what’s shown below.
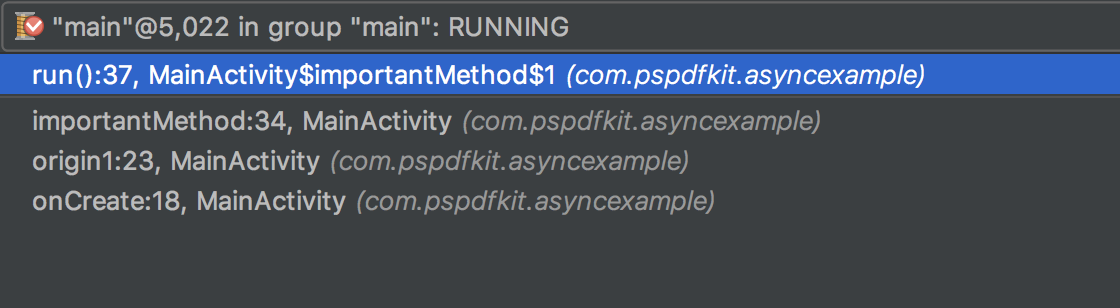
Such wow.
How-To: Make Async Stacktraces
IntelliJ’s async stacktraces work by recording stack information at specific substitution points inside your code. Later on, when you want to see the async call stack of your code, the IDE will cut and concatenate the call stack at these substitution points, creating a single async stacktrace. This even works across multiple “cuts” spanning complex asynchronous execution paths.
Let’s learn how to set this up using a simple example:
override fun onCreate(savedInstanceState: Bundle?) {
    super.onCreate(savedInstanceState)

	val thread = Thread(Runnable {
		Log.i(TAG, "Run boy run 🎶")
	})

    thread.start()
}
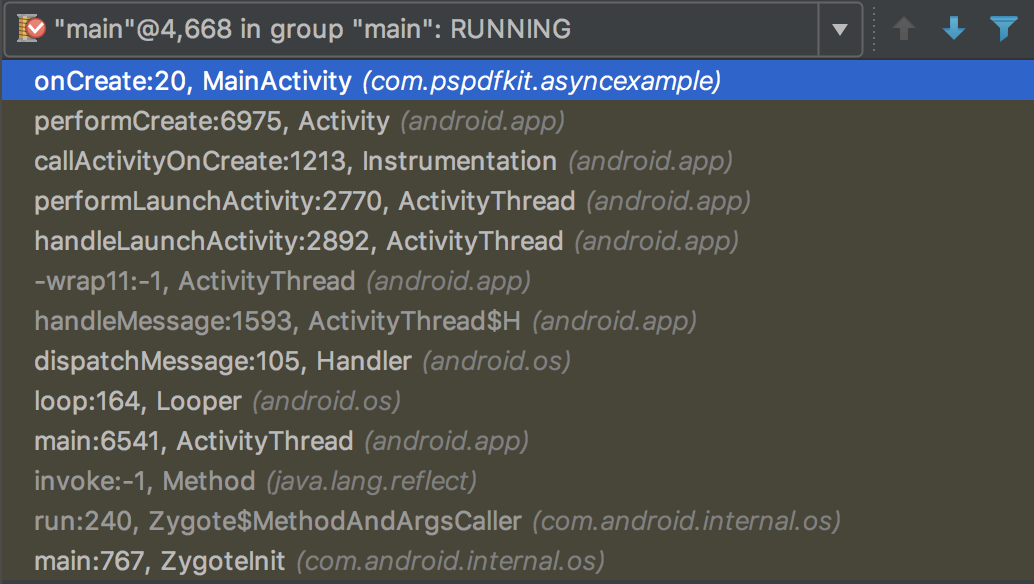
If you place a breakpoint onto the logger statement, the debugger will provide you with the following short but complete stacktrace.
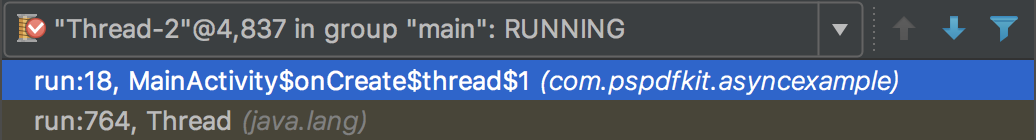
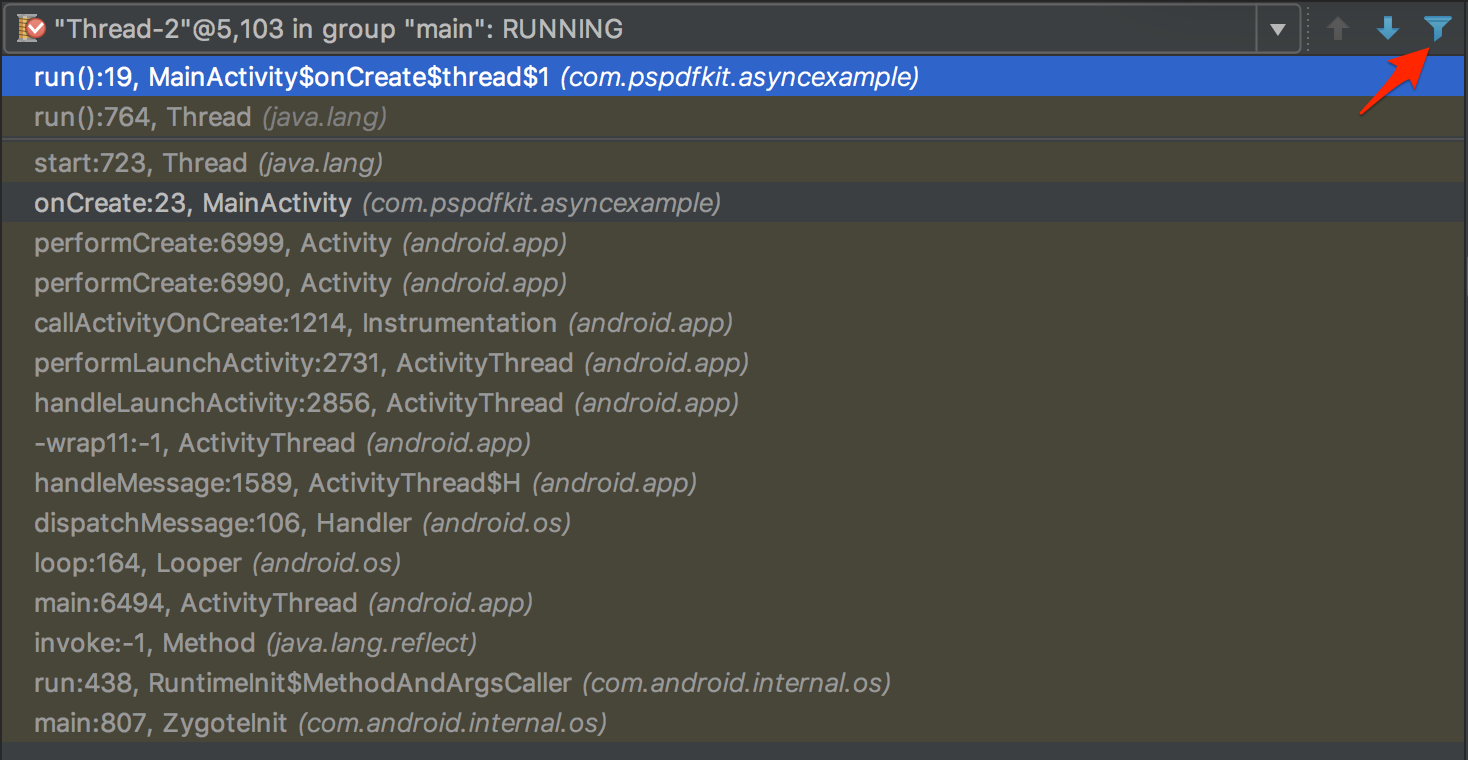
If you instead place a breakpoint onto the thread.start() statement and run the code again, you will see a stacktrace similar to what’s shown below.
Android Studio gives you an easy way of fusing these two stacktraces together to create a single async stacktrace out of them.
Let’s Do It!
Here’s a checklist for creating a stack substitution rule:
-
Find a Java object shared between both stacks.
-
Find a suitable exit method on the “outer” stack.
-
Find a suitable entrance method on the “inner” stack.
-
Set up the substitution rule.
-
Debug your code and hope your substitution rule works.
Now let’s get started!
First we have to find a Java object that is shared between both call stacks. This object will serve as an “anchor” for triggering the substitution. In both call stacks, the object has to be available as one of the following:
-
A parameter of one of the methods on the stack.
-
An instance field, accessible from the method inside the stack.
-
The
thisreference inside one of the methods on the stack.
The shared object in our case is… drumroll — the Runnable instance we’re passing into the Thread.
In the “inner” stacktrace (that is, our Thread’s stack), the Runnable’s run() method is called. In the “outer” stack (that is, on the main thread inside onCreate()), the shared object is available in both the constructor of the Thread and inside its start() method via the target instance field (look at the source code of Thread if you don’t believe me).
For both stacks, we now need to specify how to reference the “anchor” using the surrounding class and method, along with the anchor’s field name:
-
Outer stack:
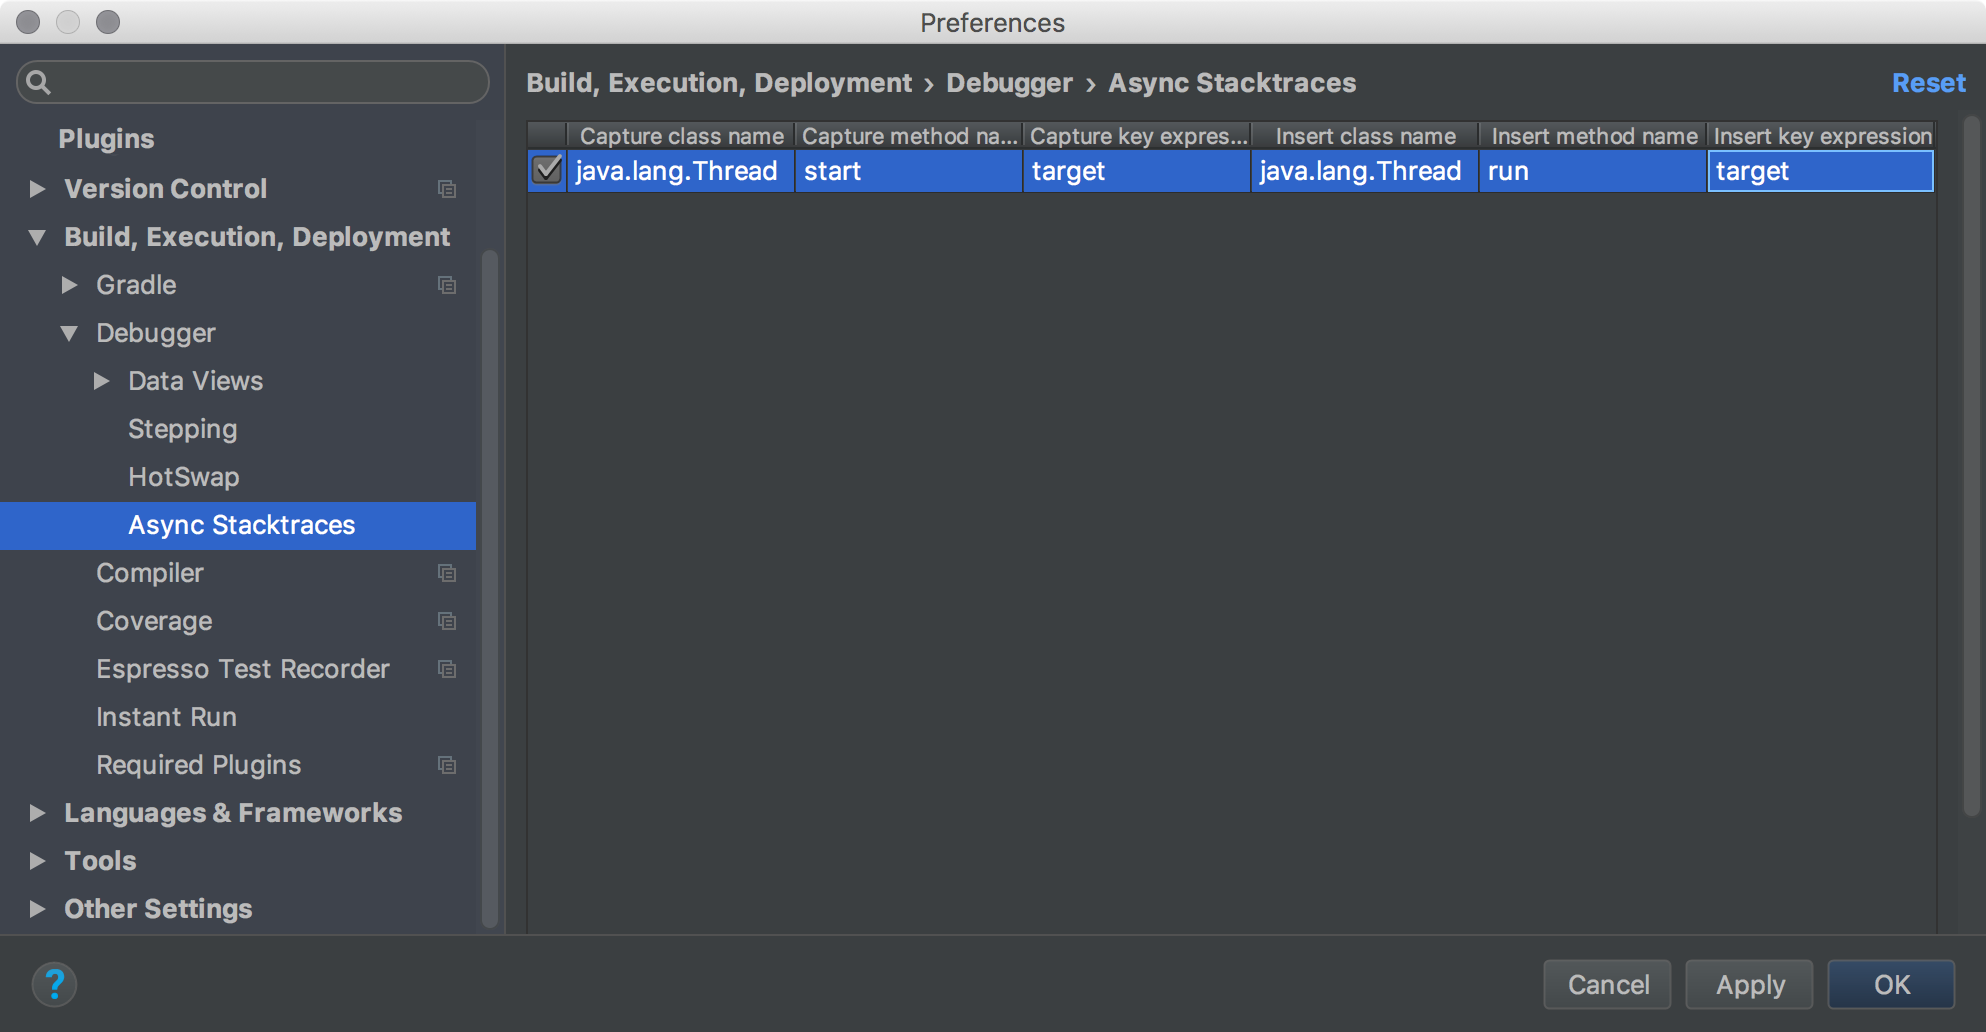
java.lang.Thread(class name),start(method name),target(anchor object name) -
Inner stack:
java.lang.Thread(class name),run(method name),target(anchor object name)
Head over to the Async Stacktrace preferences inside your IDE and enter this information.
Now debug your code, including a breakpoint on the logger statement, and experience the fruits of your labor! Note that it can sometimes be useful to filter out stack frames of third-party libraries (see the filter icon in the screenshot). This will then only show you frames inside your own source code.
The same procedure (but using the appropriate anchor names) works for the original example with origin1() and origin2() too, as well as with any other asynchronous code execution in your apps.
Where to Go from Here?
With the knowledge you just gained, you can set up async stacktraces in many other areas of your code. In general, I recommend finding low-level substitution points (like the one we found on Thread), which will make the feature even more powerful, since it will then kick in independent of your app’s structure. If you’d like to discuss this feature in more detail, you can reach out to me via Twitter.
However, I have to voice one issue I have with async stacktraces (yes, at the very end 😜): Attaching the debugger can take a considerable amount of time longer with async stacktraces enabled, since the emulator will have to create “emulated breakpoints” based on your substitution rules. In case you suffer from prolonged debugger startup times, you can disable async stacktraces by unchecking your substitution rules inside the IDE preferences and only enabling async stacktraces on demand.
Keep on coding!