Debug Emscripten with the Tracing API
We at PSPDFKit use Emscripten pretty extensively to compile our Core C++ code into WASM and offer a fully standalone PDF viewer on the Web. We recently ran into some high memory usage and were wondering how we could debug this efficiently without resorting to logging and simply hoping for the best. But then we discovered that Emscripten already comes with pretty nice memory debugging support in the form of the tracing API! Follow along to learn how to debug memory usage in an Emscripten app.
Memory Debugging
Memory debugging in a complex application is difficult if you have the proper tools, but it becomes almost impossible if you don’t have any good tools to support you. Many thousands of allocations can happen at any time, and some memory leaks can be difficult to track down. Without any tools, all you can do is try to reason about your code or add a lot of logging to your code in the hopes that you’re lucky enough that you thought of the right area of the code that could be causing problems.
Because our codebase consists of many hundreds of thousands of lines of code, we went looking for a better solution to this, and thankfully, we were successful!
The Emscripten Trace API
This API adds instrumentation to your code and your libc. What this meant for us is we could hook into calls like malloc and free to gather information about memory allocations. In addition to low-level methods, the API also provides out-of-the-box support for complete memory profiling.
Emscripten Trace Collector
The Emscripten Trace Collector is a little Python server you can run that collects information from the tracing in the Emscripten app. I was a little wary of it at first, because the last updates to it were made four years ago, but it works surprisingly well! Simply check the repository out and follow the README.rst to run it.
Configuring the Emscripten App
Emscripten has good documentation on how to configure your app for tracing. The most important thing is to configure your app with the address of the trace collector. To do this, simply add the following code at the startup of your app:
#include <emscripten/trace.h>

emscripten_trace_configure("http://127.0.0.1:5000", "MyApplication");
emscripten_trace_configure instructs the tracing API to send all the collected traces to the specified URL. By default, the trace collector listens on port 5000. You can add different application names in case you have multiple apps you want to debug at the same time.
Compiling Your App
When compiling your app, add --tracing to your emcc calls. This will include all the necessary changes, and from this point on, your app will include the tracing API. More information can be found on the Emscripten tracing website.
One little hint: If tracing doesn’t seem to work, call emcc --clear-cache. The libc also has to be instrumented, but Emscripten caches it and doesn’t invalidate the cache when you switch to --tracing.
Running the App
When all this is done, simply run your Emscripten app like you always do. Then connect with your browser to the tracing URL you configured (in our example, http://127.0.0.1:5000). This will be the interface to seeing what is happening in your app.
You will then be greeted with the first tracing output of your app.
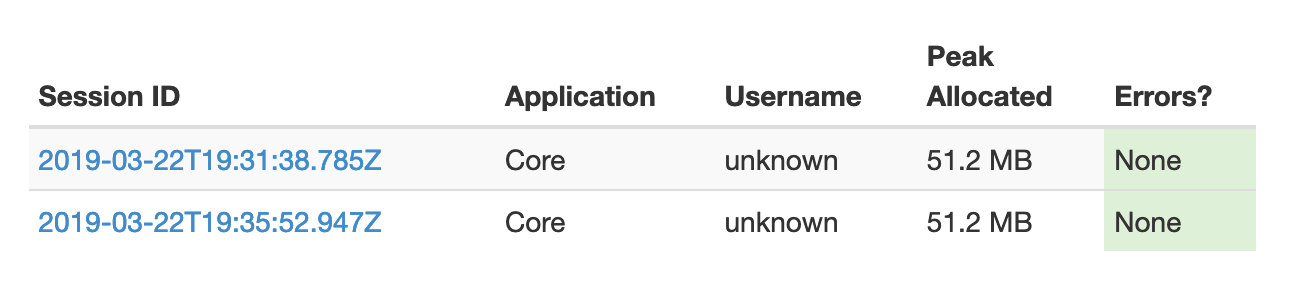
Annotating Your Code
The first tracing output already gives you a lot of information, such as how much memory is currently allocated, how much memory was allocated at peak, and much more (shown below).
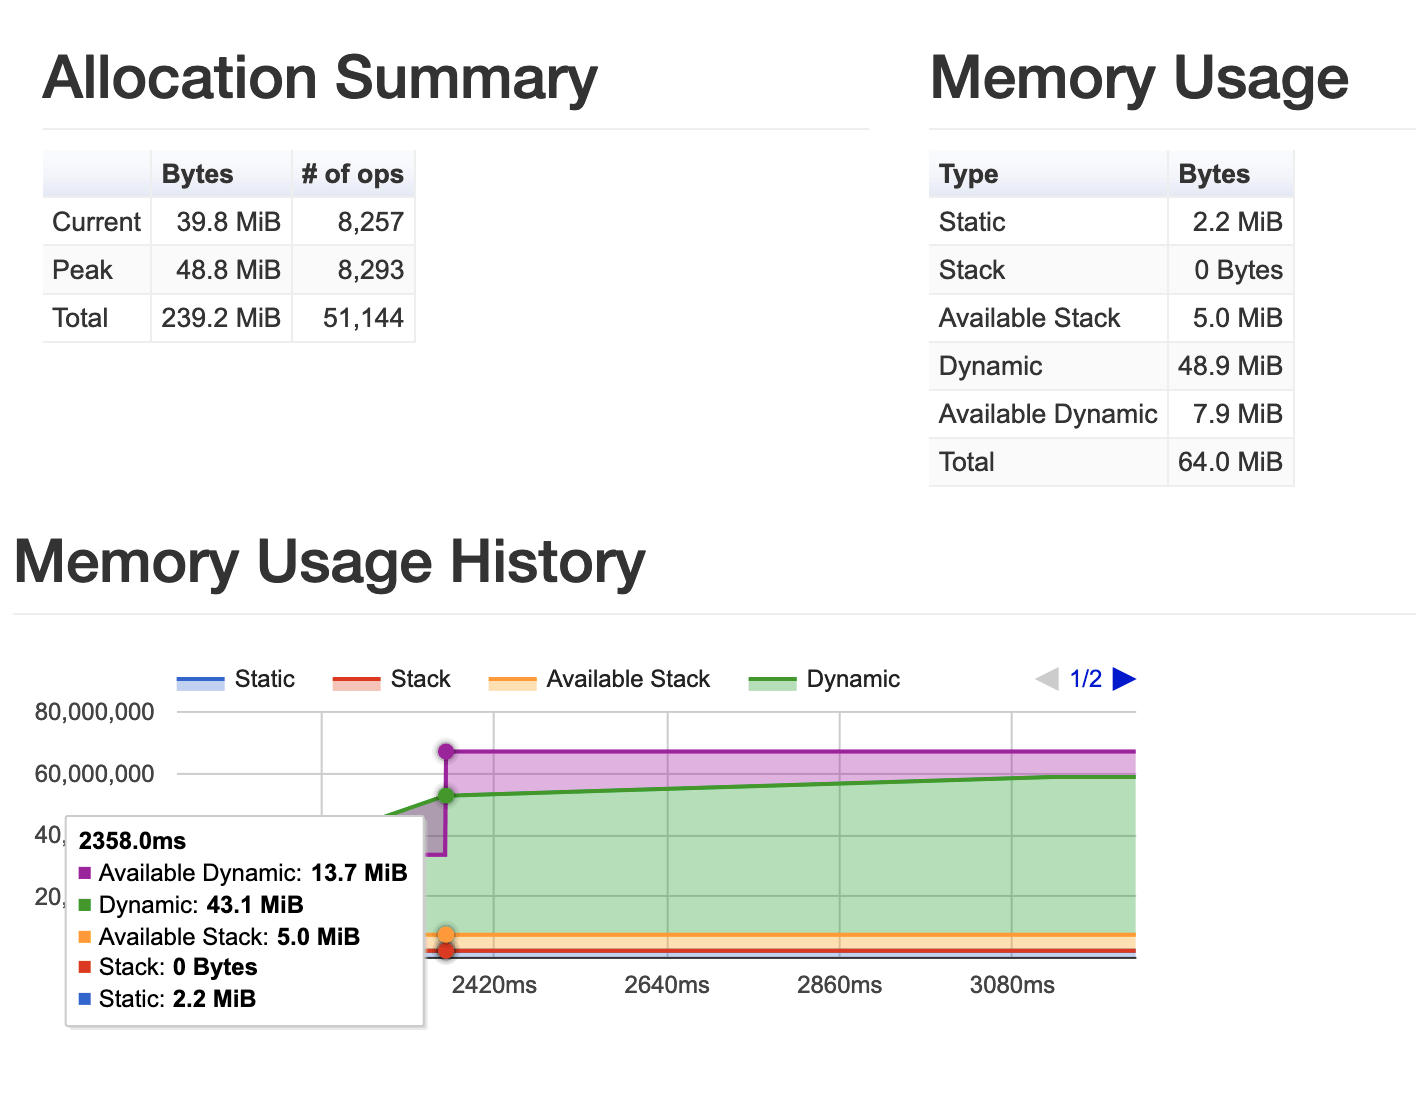
The tracing API has lots of other neat features, though!
Annotating Memory
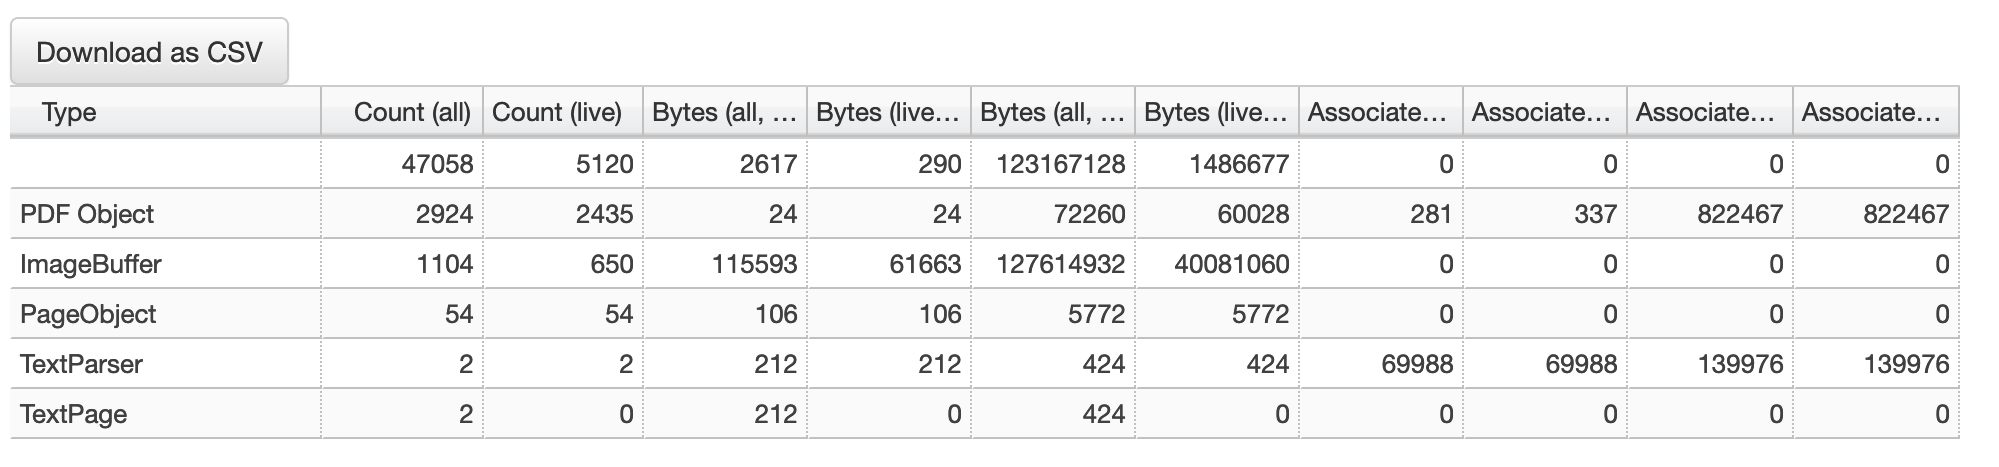
Without some help, the tracing API only knows how much memory was allocated and not which part of your program is using that memory. But by annotating your pointers, you can associate a name to the memory pointers:
MyClass class;
emscripten_trace_annotate_address_type(&class, "MyClass");
Now the UI of the trace collector will be able to tell you how many instances of the class MyClass are alive, when they were allocated and deallocated, and much more.
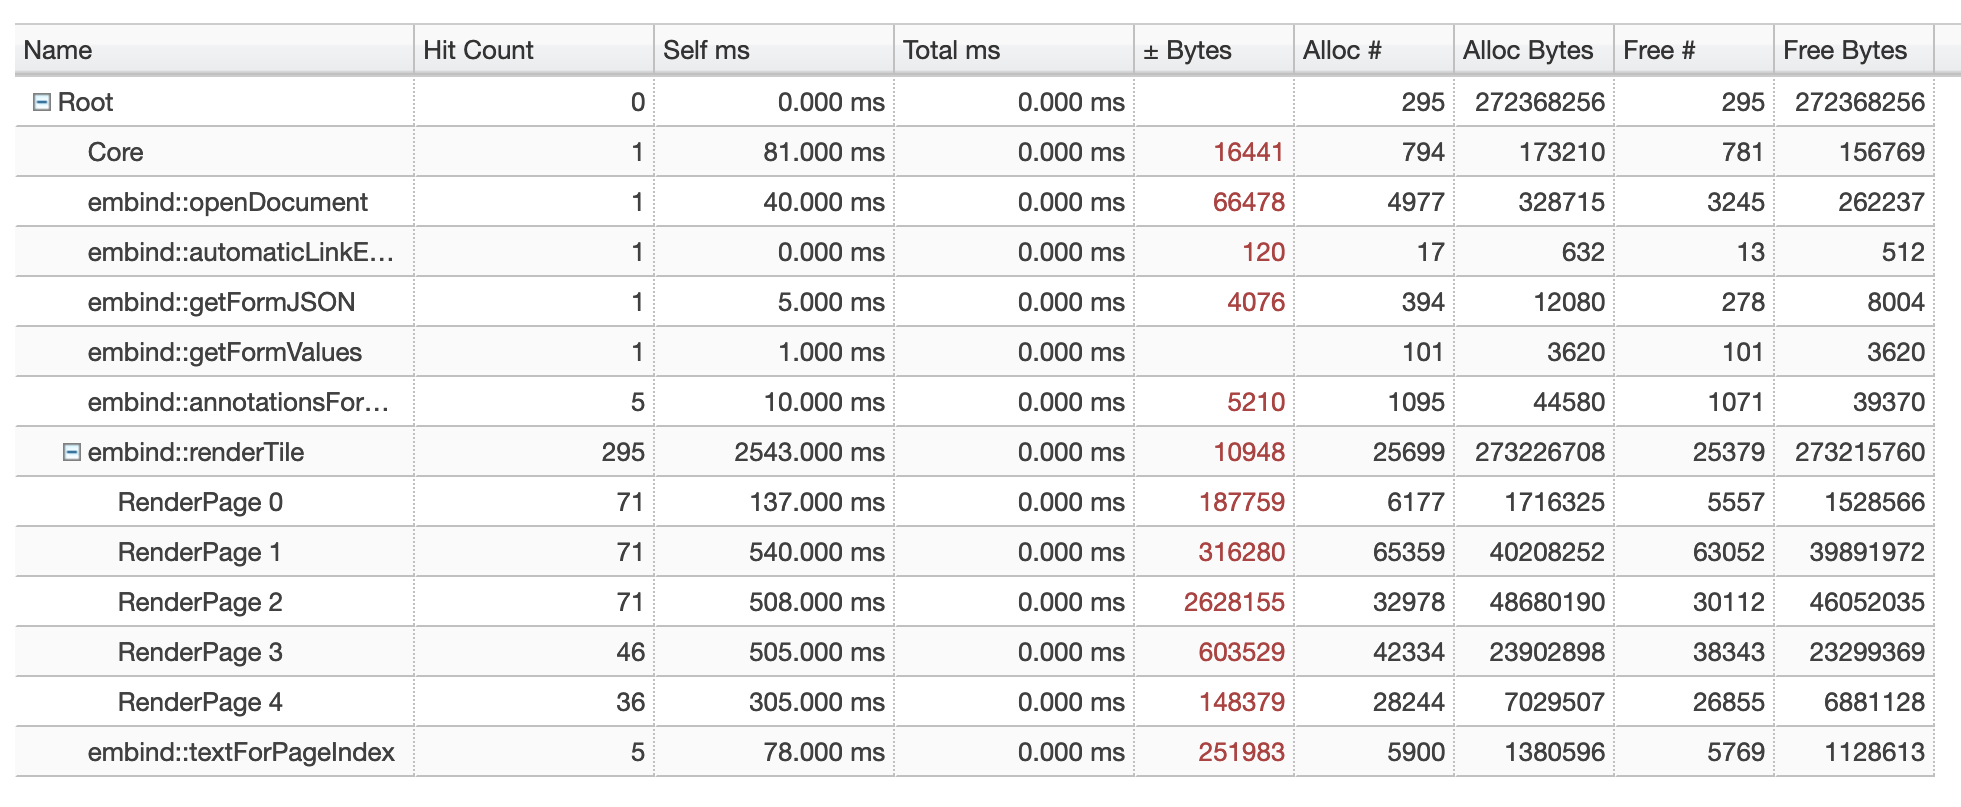
Contexts
You can specify contexts in your code. For example, we defined contexts for rendering a page. This shows how much memory was allocated during a context and how much was released:
#include <emscripten/trace.h>

emscripten_trace_enter_context("Render Page");
... render page ...
emscripten_trace_exit_context();
There are quite a few more ways to annotate your code, all of which you can read up on. For example, you can log messages or report errors.
Conclusion
Having the proper tools to debug your code is always very important. Without these, it would have been far more difficult for us to optimize our memory, like we did in one of our past releases.

Patrik is the team lead of the Core Team, which oversees the shared codebase between our products. He knows far too many things about PDFs — ask him about fonts!