Frontend Performance Enhancements at PSPDFKit


Here at PSPDFKit, as our product grows, it’s important for us to balance performance improvements with new and innovative features. This is because high frame rates and a low CPU load are not only major factors in user experience, but the latter is also a show of respect toward our users’ hardware and electricity bills.
However, working on a product shipped on so many different devices and platforms means performance enhancements can often be challenging without clean and structured methodology.
Our latest performance improvement revolved around our Web platform’s ink drawing annotations, which generate dynamic SVG paths in real time. So I’d like to take you on a little walk showing you how we turned this:
Into this:
(recorded on iPad mini 4, iOS 14.2)
How Did We Do That?
Improving performance is necessary when we’re aware of specific features experiencing issues, or when we can see performance is suffering and we do a general audit to determine the cause. Then, once we know what’s causing the issue, it’s important to get our bearings before we dive into the source code.
Just as artisans can’t enhance their work without the proper tools, neither can we. So we turn to our best friends: developer consoles. Even a courteous glance at the performance tab will often reveal a lot about the issues we may be facing.
Memory curve spiking without reasonable garbage collection? We’re likely dealing with non-collected values becoming too large. It could be a simple issue like variables being assigned to a root object, or arrays used to cache reused data being appended to, without checking for duplicates.
Listener calls taking an unreasonable amount of time? We’re likely overloading the main thread, especially when we’re rendering animations.
Let’s tackle this task step by step to show the process (without the benefit of hindsight).
Diagnosing the Problem
We got started by recording performance metrics on various browsers. It’s important to find a middle ground on the number of tests: too few and our results will suffer the potential of inaccuracy. Too many and we’ll end up wasting time for, at best, minimally higher accuracy of our test results.
As a rule of thumb, we like to run, at the very least, five tests per browser and operating system. If we find discrepancies within these five, increasing the number of tests by another five has served us well.
When we’ve reached the point where performance graphs alone don’t point to a single source of performance bottlenecks, we like to start diving into source code (finally). One reasonable approach to improving the performance of our service is to construct a checklist of every function, method (and possible side effects), and dependency called throughout the lifecycle.
In the case of the ink drawing improvements outlined above, we noticed several points with potential for improvement, which we used to compile our list. Great!
Upon further inspection, we found that the generated paths had immaculate accuracy deep within the realm of subpixel space. While this is fantastic for representing the drawn data even on large scales, accuracy this high can lead to two issues:
-
Drawing complexity increases, resulting in higher frame times and main thread load
-
Significantly larger strings with path coordinates, which need to be dealt with accordingly by the garbage collector
Experimenting
Given the two assumptions above, when reducing the accuracy of our generated SVG paths, we should expect less expensive rendering and the reduction of the required memory capacity. Both of these would improve the performance of our feature, since needing less memory results in fewer garbage collections, which results in lower CPU usage.
Unfortunately, there’s no way to determine a single source of truth when it comes to necessary accuracy, which is why we decided to dynamically calculate the accuracy of our SVG paths depending on a user’s screen ratio and zoom level.
This change reduces the number of decimals within the SVG path coordinates to a level of accuracy high enough to display the correct paths while saving resources and improving performance.
At this point, we’ve reached the most important part, which applies to every performance improvement regardless of platform, language, or device: tests and measurements.
Testing and Measuring
We as programmers can (and should) be extremely happy to work in a field in which nearly every opinion or idea can be measured, and it’s incredibly important to remain open minded, especially if tests and measurements invalidate our suggestions/ideas. At the end of the day, this is the best way to improve our understanding of something we evidently had misconceptions about before.
So we apply the changes, which no longer result in subpixel accuracy of the generated SVG paths, and we get results (see below).
Memory Graphs
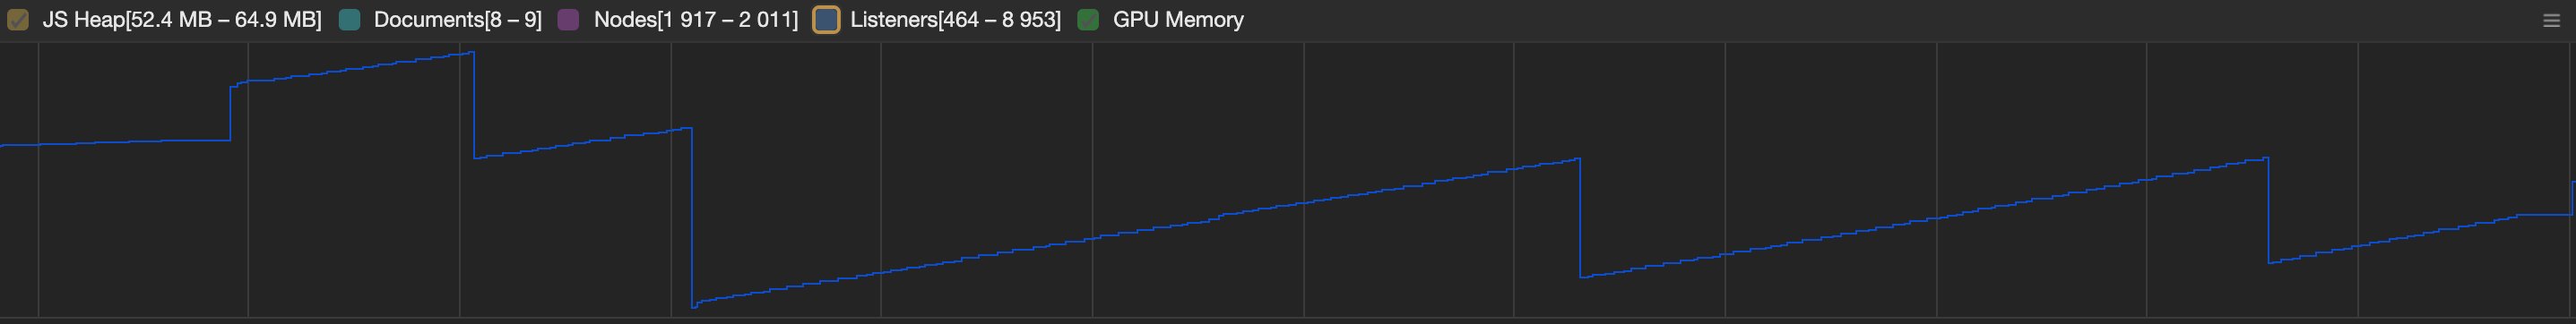
Before
After
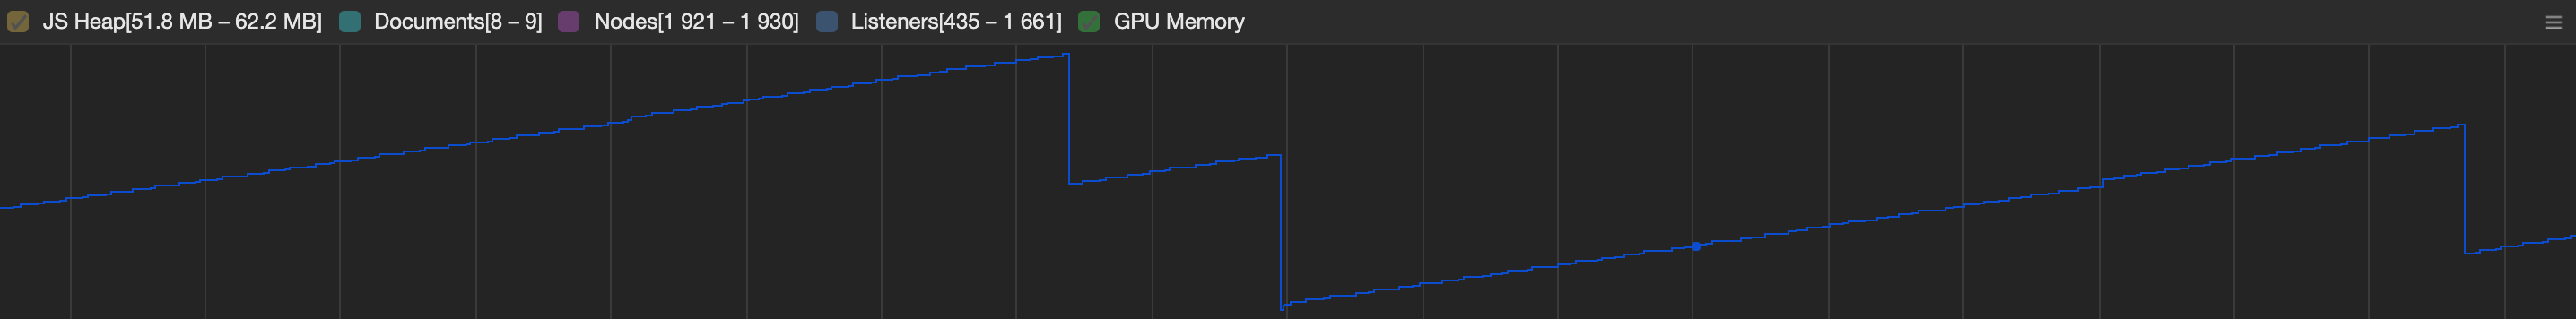
Peaks within the memory graph indicate high memory usage, and they’re followed by valleys caused by the garbage collector being activated to free up space. Each collection requires the CPU to perform many tasks: scanning the memory, moving data between memory spaces, and removing data from memory in general. Because garbage collection is so expensive, the goal is to reduce the number of collections while keeping the required memory as low as we can.
If we manage the first but fail to do the latter, we end up with what’s called a memory leak, which is where more and more space is required without it ever being freed.
This simple fix alone improved the measured frame rate lows during high thread load by up to three times and cut garbage collection roughly in half. As surprising as it sounds, considering this fix could be broken down to “fewer decimals most of the time,” little changes can have a massive impact. This proves our initial assumptions correct.
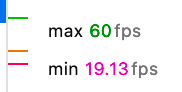
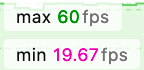
A big factor of perceived performance is the browser frame rate during operations which, by default, is capped at 60 FPS (frames per second). The max and min values stand for the maximum and minimum achieved frame rates. A maximum frame rate of 60 FPS is both common and misleading, since this will easily be achieved if there are even miniscule amounts of low thread load. During expensive operations, raising the minimum frame rate becomes incredibly important, as this is what allows us to provide a more stable and smooth experience with the platform.
FPS Lows
Before
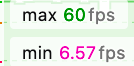
After
Rinsing and Repeating
After a successful first catch, we need to repeat the steps we took for each potential bottleneck we found and added to our list.
A base understanding of JavaScript memory management is crucial for modern web development and developers. Many applications deal with incredible amounts of data and can easily spiral out of control if we don’t pay attention. In having a solid understanding of our respective codebases and a basic understanding of JavaScript memory management, debugging memory leaks becomes much easier, faster, and more satisfying.
Since it’s easy to write loops poorly, looking at them is always a good idea. We saw that within one of our logic loops, there were several variables created on each iteration. Intuition would dictate that creating a variable should be outperformed by reassigning values, as the steps of allocating and deallocating space should be omitted, so we tried hoisting these variables out of the loop. After all, there’s a reason why this is common practice in game development, right? We’re clearly quite sure this is an improvement, so why bother testing at all?
Just for the sake of being thorough, let’s humor the possibility of us being wrong:
Oh. While at first glance we could assume this to be a minor improvement, this is merely a snapshot of a bigger picture and well within margins of error. It may be tempting to choose data subsets that verify our initial assumption, but confirmation bias won’t improve our product. But how can this not offer tangible improvement?
JavaScript memory management works on the principle of reachability. Values in memory that are no longer reachable are marked for deletion and collected by the garbage collector when a magic threshold is reached (I’m using the word magic because this logic is governed by the engine of your browser and is subject to change at all times). As with every language relying on a garbage collector, our memory profile will look fundamentally different to pointer- or ownership-based memory management (the latter of which wouldn’t even allow for the operation we attempted previously without cutting corners).
When reassigning values to existing variables, each assignment marks the previous value for deletion as the loop progresses through its block. This process repeats each iteration of the loop.
When creating new variables within the loop, each iteration of the loop marks the used variables for deletion depending on your scoping. var variables will exhibit the behavior explained above, while let or const variables will become unreachable upon the next iteration of the loop since they’re scoped to the block.
So what does this mean? It means that our change results in nearly identical work for the engine and our CPU, and as such, cannot offer tangible improvements.
This is a clear example of why testing is so important. Even intuitive solutions may offer no improvement at all or, worst-case scenario, backfire and perform worse than before — all of this often coming at the cost of safety and code readability.
What We Learned
While it’s tempting to forego lengthy testing processes, we must concede to the fact that the computer always has the potential to be smarter than us (I mean… it is, most of the time). Especially when delving deep into engine-specific matters such as garbage collection, it’s safe to assume that things may be optimized differently than we’d have thought. Measurements are an invaluable tool to ensure consistent improvements of our product are delivered while keeping everyone on the same page.
This latest stage of performance enhancements served extremely well to strengthen our deeply held beliefs about the importance of performance, along with the continuous growth of our own knowledge, skill, and — most importantly — our product.
TL;DR
-
Isolate the problem.
-
Compile a list of possible reasons.
-
Be prepared to question your assumptions.
-
Test each improvement individually AND collaboratively (we’re usually dealing with long chains of dependencies, which can all affect following processes).
-
Document all changes, even if there was no change or performance deterioration.
-
Supply test data (screenshots, logs, whatever you have available).
-
GOTO1.
We want our peers to be able to understand what was going on and why certain changes were made. Everyone has their opinions, but all doubt can be dispelled by hard data and facts. Additionally, you do look cooler at the end of it all. 8)