Automated Profiling Runs in Instruments
 Daniel Demiss

“Premature optimization is the root of all evil” is probably one of the most misquoted statements in software development. The key idea behind the original statement in context, however — that we should measure in order to guide our optimization efforts — is as true today as it was in 1974. And in this article, we’ll explore how the use of XCUITest — the framework for automated UI testing that ships with Xcode — and Instruments make holistic performance measurements reproducible, and therefore quantifiable.
What Is Performance and Why Does It Matter?
It’s no secret that computers continue to get more and more capable year over year. The phone I carry in my pocket probably has about the same persistent storage capacity as all of earth’s computers from the year when the opening statement of this article was made combined. And its raw computing power easily outperforms any supercomputer money could have bought at the time. And still, I will easily find applications or documents that don’t seem complex, yet will make my phone irresponsive when I try to use them.
The sad truth is that all the advancements we’ve made in terms of processors and memory are easily consumed by us throwing ever bigger tasks at them and caring less about how those tasks are implemented (knowing that next year’s devices will perform them more easily) or whether they are worth executing at all.
When talking about performance, we have to distinguish between at least three things that can — but don’t have to — be related:
-
How long does it take to perform a certain task?
-
How many tasks can I perform given the limited resources (time, memory, bandwidth, battery) I have available?
-
How long does a task block me from doing something else?
Answering the first question is straightforward: You perform the same task many times over and measure the time it takes until all instances of that task are complete. Better yet, answering this question can be automated using Xcode’s performance tests: Assuming you follow best practices and have a machine that runs your full test suite before you integrate code changes, this machine can track the gains of optimizations and warn you when code changes slow down the completion of those tasks.
In many regards, performance tests in Xcode are similar to unit tests: They are useful to have and relatively cheap to set up and keep up to date. But while they help you maintain the fitness of your code on a small scale, it’s perfectly possible that your app or component has problems that render it unusable even though you have a lot of unit tests for it.
While measuring how long performing a very specific task will take in isolation is useful and will probably benefit the people using your code, what these people really care about is how much use they can get out of your code before they have to recharge their device or top up their data plan, and how long they will have to wait before they will be able to do something else. Typical applications try/have to do a lot of things “at once.” Therefore, if you achieve a speedup by parallelizing a certain task, you may harm those other things that are usually running “at the same time.” And your performance tests will never tell you.
Assessing these kinds of situations requires a more holistic approach. And this is where profiling in Instruments comes into play.
Instruments is the toolbox for measuring resource utilization on Apple hardware. The concept is as simple as it is powerful: Instruments provides a library of probes, called “instruments.” Each of these probes either samples a certain aspect of your program at a fixed rate or responds to system-level events triggered by your program. After combining the probes for all the metrics you are interested in, you start recording, perform a workflow in your program, and stop recording. Instruments then gathers all the readings it collected during such a “run” on a timeline so that the data can be analyzed later.
The downside of this is that it is effectively a manual test. And while it is inherently useful for exploration, manual testing doesn’t scale. If you actually want to make quantifiable statements, manual testing makes it hard to compare two consecutive runs: You will likely do something differently each time you repeat it. So you have to repeat the same measurement many times to limit the effect of these fluctuations.
Requiem to UIAutomation
Because manually repeating the same thing over and over again is not only annoying, but also hard, Instruments used to have a tool for this built in: The UIAutomation instrument, which was introduced with the iOS 4 SDK during WWDC 2010, lets you interactively record or manually write JavaScript code that would use the accessibility interface of a program to drive it.
When combined with other instruments, this allowed you to repeat a measurement with the touch of a button. And because the individual runs would show less variation, you didn’t have to do as many repetitions to establish a baseline to compare your optimization efforts against.
Unfortunately, this instrument is no more: When Xcode 7 introduced the XCUI family of APIs to the XCTest framework, the UIAutomation instrument was removed.
In several regards, the XCUI APIs are a significant improvement over the UIAutomation instrument: While the documentation of the JavaScript API for writing UIAutomation scripts was accurate, the editor you got for writing them within Instruments left a lot to be desired when compared to Xcode — which isn’t exactly known for offering a great JavaScript development experience in the first place.
In addition, some things were never documented — like the fact that the JavaScript files were actually preprocessed so you could #import your own library of functions to build maintainable workflows…
Last but not least, there’s the fact that a lot of people really seem to loathe JavaScript.
So we lost the ease of automatically profiling a workflow, but we got a way more streamlined way of writing and executing UI tests.
Everything’s Not Lost
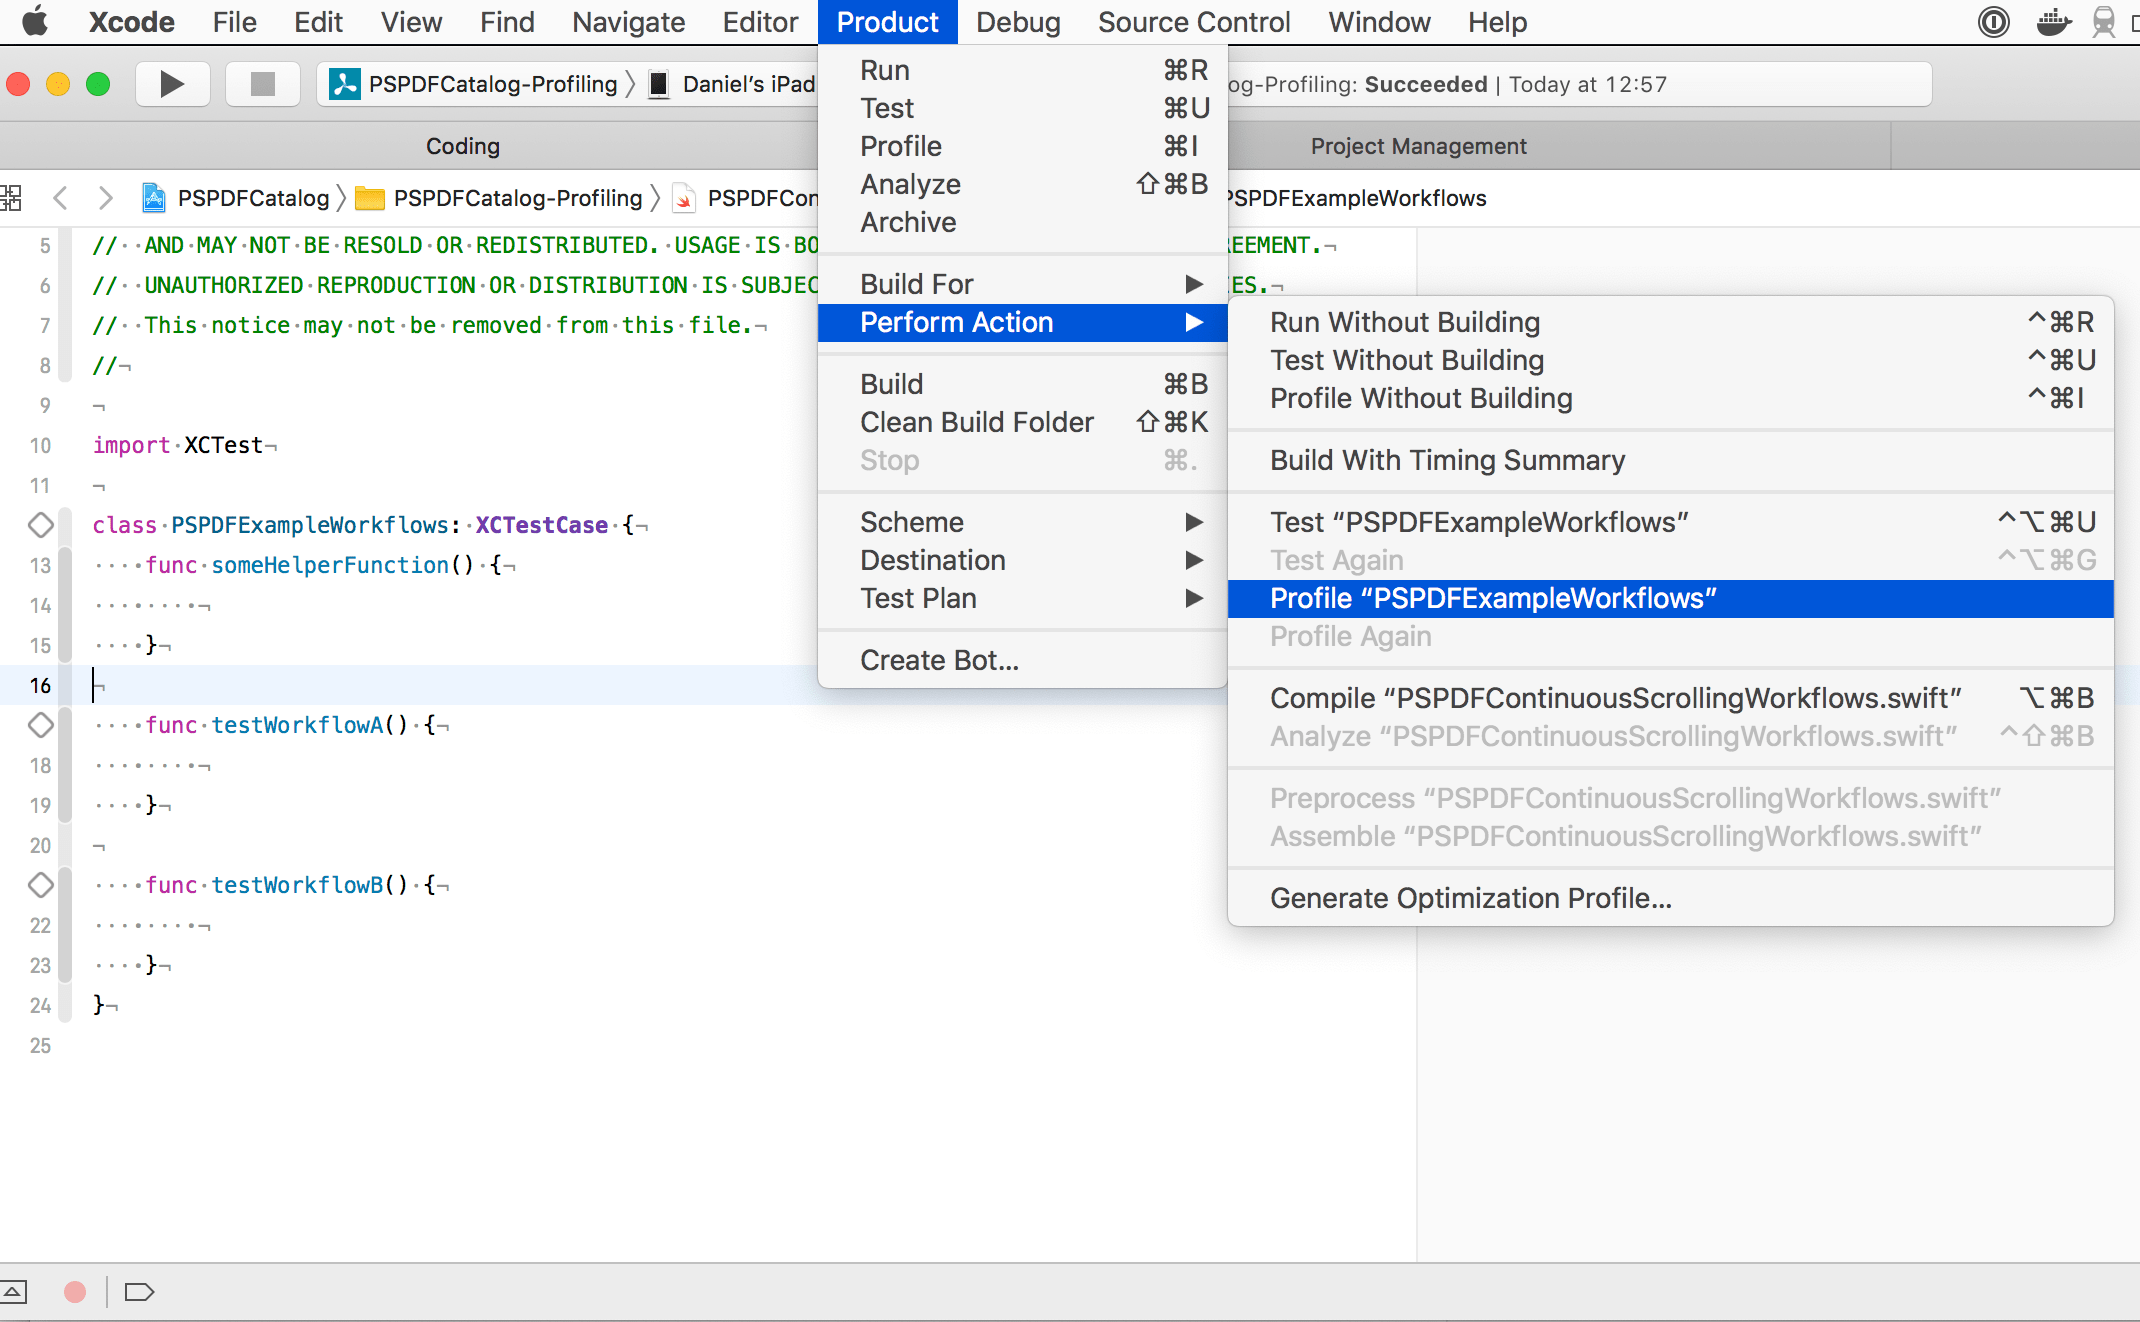
Xcode is a treasure trove of immensely useful but well-hidden functionality. One such gem is the ability to profile tests: When you place the cursor in the body of a test method or a test class that belongs to the currently selected scheme, the Perform Action submenu of Xcode’s Product menu will offer the option to “Profile <name of the test case or suite>.”
Most importantly, this also works with the XCUI testing facilities!
Placing the text cursor inside the body or @implementation block of your test class but outside any method body allows profiling all the test cases in this class, as shown below.

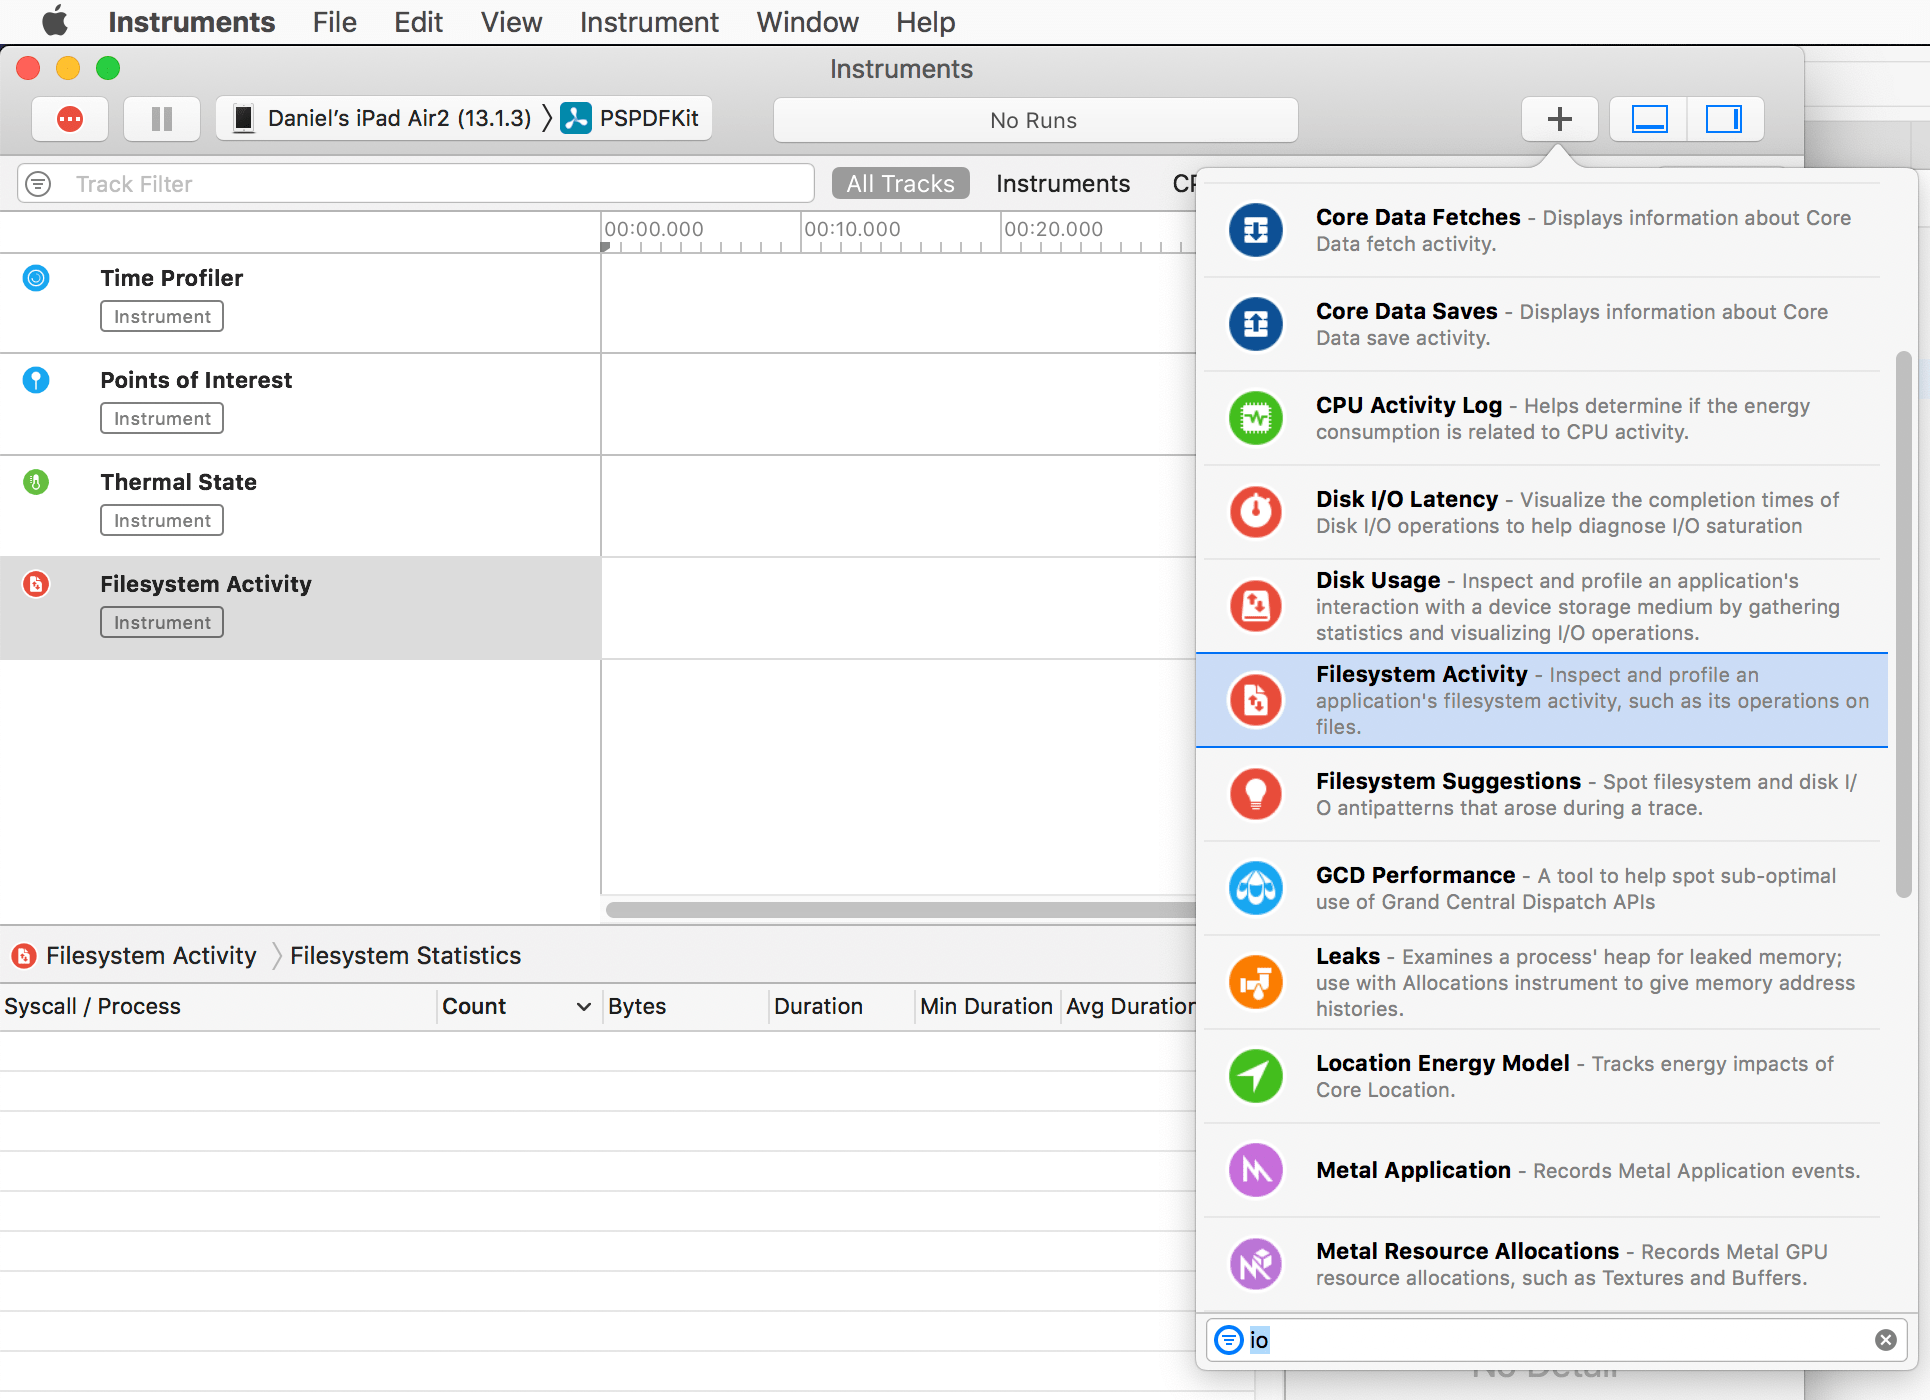
When you choose the option highlighted in the screenshot, Xcode will build your application and tests and launch Instruments to pick a template, and when you press the record button in Instruments, it will start executing testWorkflowA() and testWorkflowB() in alphabetical order.
Speaking of Instruments and holistic measuring: The Time Profiler template is usually a great starting point, but before you press the record button, consider adding other probes from the library.

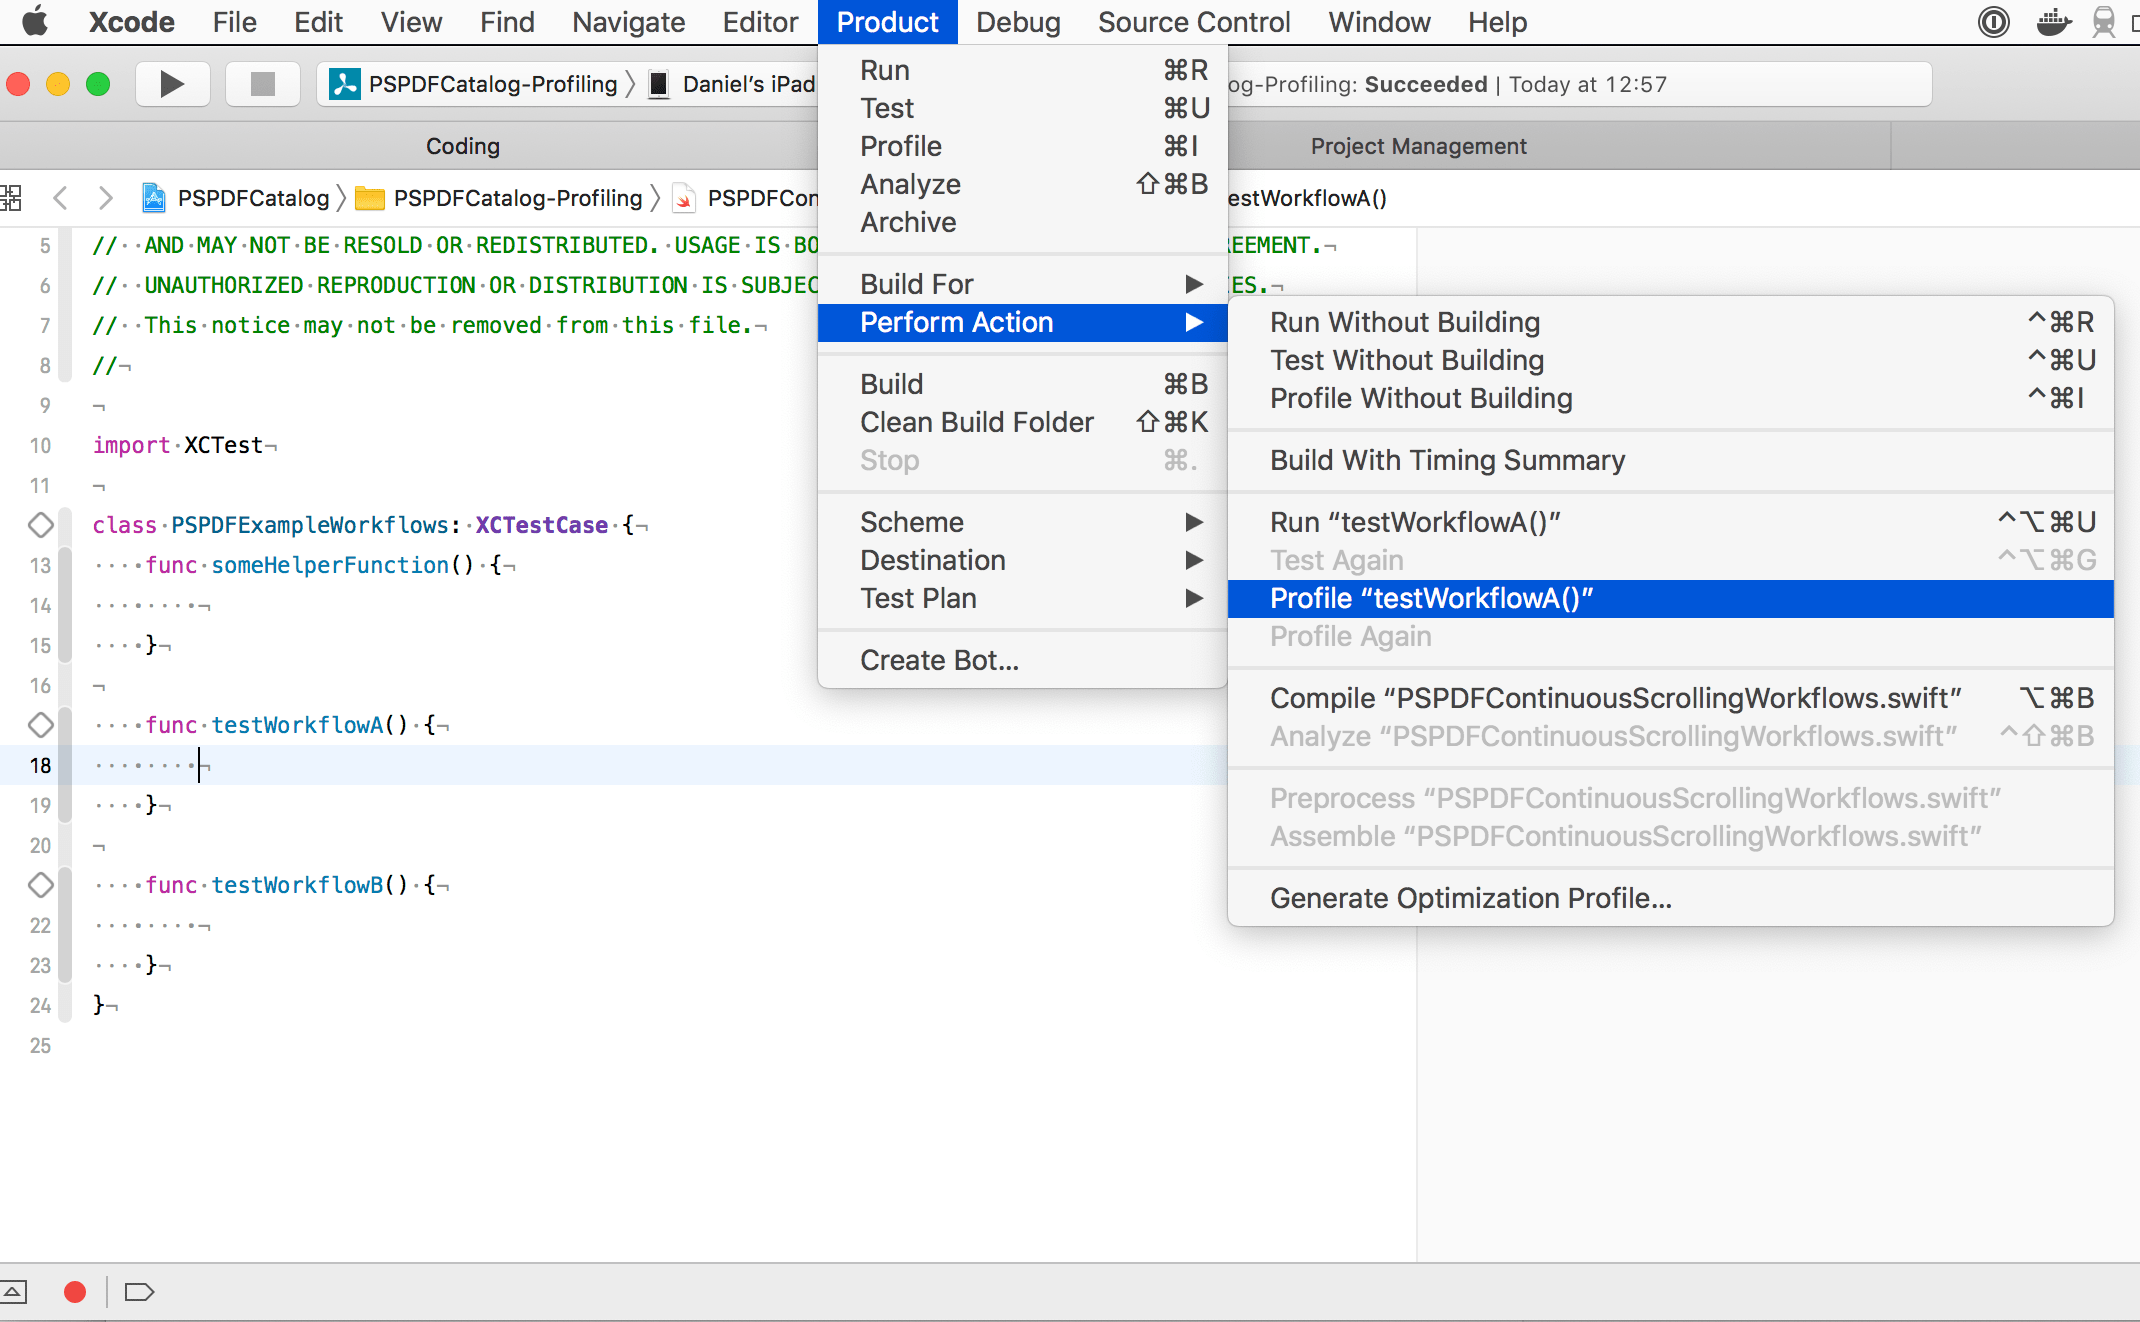
If you want to profile just one specific test case, place the text cursor inside the body of that particular test method, like shown below.

Note how the title of the highlighted option changed. Also note how, in contrast to the previous placement of the text cursor, the record button inside the editor window is no longer greyed out: In many cases, merely pressing this button allows you to interactively record the workflow you want to profile.
Trouble
Once you’ve started automating your Instruments runs, you will very quickly run into the problem of residual state: Did I remember to clear all caches/the saved application state in the installed app? In more complex apps, getting to the flow you want to profile can also be annoying. And lastly, there will often be the lingering question: Will I start my profile run using the correct seed data?
Don’t Panic
XCUIApplication allows straightforward customization of the launchArguments and launchEnvironment to use when launching the application under test. So those problems can be addressed by interpreting ProcessInfo.arguments when your application is launched. To not bloat your app delegate, it makes sense to factor this functionality out into a separate configuration class/struct that knows how to serialize itself to/parse an array of launch arguments. Your app delegate can then take this parsed configuration and act upon it.
Take this very simplistic example:
@interface PSPDFLaunchOptions : NSObject

#pragma mark Example Properties — add your own as needed

/**
 A deep link that takes you to the workflow you want to measure.

 If you already support universal links in your app, using this will come for free. If you don’t,
 this is a great chance to change that. 😅
 */
@property (nonatomic) NSURL *universalLink;

/**
 If your app has multiple caches, you will probably want a bitmask instead.

 The idea is the same: Caching will skew the results of your profiling runs. So make sure you can start at a well-established baseline.
 */
@property (nonatomic) BOOL shouldClearCache;

/**
 Same as above: If you have multiple caches, you will want a bitmask to selectively disable them.

 Using this property may require additional infrastructure in your app. If you are rigorously using
 dependency injection, supporting such an option will be fairly cheap. With loads of singletons, it
 will probably be harder.
 */
@property (nonatomic) BOOL ignoreCache;

#pragma mark (De-)Serialization
/**
 Create a new instance from the `arguments` property of `NSProcessInfo`.
 */
+ (instancetype)launchOptionsFromArguments:(NSArray<NSString *> *)arguments;

/**
 Append the receiver’s configuration to the given array, so that it can be deserialized using
 `+launchOptionsFromArguments:`.
 */
- (void)appendToArgumentsArray:(NSMutableArray<NSString *> *)arguments;

@end

@implementation PSPDFLaunchOptions

- (instancetype)init {
    if ((self = [super init])) {
        // `BOOL`s are `NO` by default, but we need a base URL, similar to a cold start of your app.
        _universalLink = …;
    }

    return self;
}

static const struct {
    NSString *universalLink;
    NSString *shouldClearCache;
    NSString *mayUseCache;
} sParameterNames = {
    .universalLink = @"--universal-link",
    .shouldClearCache = @"--should-clear-cache",
    .ignoreCache = @"--ignore-cache",
};

- (void)appendToArgumentsArray:(NSMutableArray<NSString *> *)arguments {
    [arguments addObject:sParameterNames.universalLink];
    [arguments addObject:(id)self.universalLink.absoluteString];
    if (self.shouldClearCache) {
        [arguments addObject:sParameterNames.shouldClearCache];
        [arguments addObject:@"yes"];
    }
    if (self.ignoreCache) {
        [arguments addObject:sParameterNames.ignoreCache];
        [arguments addObject:@"yes"];
    }
}

+ (instancetype)launchOptionsFromArguments:(NSArray<NSString *> *)arguments {
    PSPDFLaunchOptions *instance = [self new];
    NSEnumerator<NSString *> *argumentEnumerator = arguments.objectEnumerator;
    NSString *argument;
    while ((argument = argumentEnumerator.nextObject)) {
        if ([argument isEqualToString:sParameterNames.universalLink]) {
            NSString *string = argumentEnumerator.nextObject;
            NSURL *universalLink = [NSURL URLWithString:string];
            NSAssert(universalLink != nil, @"'%@' is not a valid URL", string);
            instance.universalLink = universalLink;
        } else if ([argument isEqualToString:sParameterNames.shouldClearCache]) {
            instance.shouldClearCache = argumentEnumerator.nextObject.boolValue;
        } else if ([argument isEqualToString:sParameterNames.ignoreCache]) {
            instance.ignoreCache = argumentEnumerator.nextObject.boolValue;
        }
    }
    return instance;
}

@end
struct LaunchOptions {

/// :MARK: Example Properties — add your own as needed
    /**
     A deep link that takes you to the workflow you want to measure.

     If you already support universal links in your app, using this will come for free. If you don’t,
     this is a great chance to change that. 😅
     */
    var universalLink = URL(string: /* some base URL — should be similar to a cold start of your app */)!

    /**
     If your app has multiple caches, you will probably want an `OptionSet` instead.

     The idea is the same: Caching will skew the results of your profiling runs. So make sure you can start at a well-established baseline.
     */
    var shouldClearCache = true

    /**
     Same as above: If you have multiple caches, you will want an `OptionSet` to selectively disable them.

     Using this property may require additional infrastructure in your app. If you are rigorously using
     dependency injection, supporting such an option will be fairly cheap. With loads of singletons, it
     will probably be harder.
     */
    var ignoreCache = false

    enum Parameter: String {
        case universalLink = "--universal-link"
        case shouldClearCache = "--should-clear-cache"
        case ignoreCache = "--ignore-cache"
    }
}

/// (De-)Serialization
extension LaunchOptions {
    func append(to arguments: [String]) -> [String] {
        var combinedArguments = arguments
        combinedArguments.append(Parameter.universalLink.rawValue)
        combinedArguments.append(universalLink.absoluteString)
        if shouldClearCache {
            combinedArguments.append(Parameter.shouldClearCache.rawValue)
            combinedArguments.append("yes")
        }
        if ignoreCache {
            combinedArguments.append(Parameter.ignoreCache.rawValue)
            combinedArguments.append("yes")
        }

        return combinedArguments
    }

    init(arguments: [String]) {
        self.init()
        var options = arguments.makeIterator()
        while let option = options.next() {
            guard let parameter = Parameter(rawValue: option) else { continue }

            switch parameter {
            case .universalLink:
                universalLink = URL(string: options.next()!)!
            case .shouldClearCache:
                shouldClearCache = (options.next()! as NSString).boolValue
            case .ignoreCache:
                ignoreCache = (options.next()! as NSString).boolValue
            }
        }
    }
}
The beauty of this approach is that you can now use the same class/struct in the +setUp method for the test suite you want to profile, all without running into typos, capitalization mismatches, implicit order dependencies, and so forth.
Limitations
At the time of writing, I have not found a way to automate running such a profiling task. Of course, the most elaborate suite of profiling workflows is worthless if you don’t regularly run it and see how the results change over time. But manually navigating to the profiling suite, selecting the correct scheme in Xcode, placing the cursor where it should be, and then selecting the “Profile <test suite name>” menu item is inconvenient enough to not do it regularly.
Like UIAutomation’s JavaScript API before it, the XCUI API uses the accessibility interface of your application. And one of the sad truths of iOS development is that the VoiceOver interface is an afterthought more often than not. So depending on how much you care about accessibility, automation may incur a non-trivial cost in improving your application’s VoiceOver UI. But even when your app is fully accessible, you will be limited by what you can automate: Any interactions beyond “tap on this element,” “scroll that element,” and “turn the device to that orientation” are out of reach. Most notably, there is no API that allows you to say “start a touch at this coordinate, follow a path around the screen, with those velocities, and lift the touch at that coordinate.” So automated profiling of e.g. the frame rate of a drawing view will remain off the table for the foreseeable future…
And then there are bugs. Accurate profiling requires running on the device. Unfortunately, there is a bug in Xcode 11 that leads to the test application not being installed when you choose to profile a UI test. If you do not manually install the application you want to automate, the test will error out because the application could not be launched.
Conclusion
While the most common use case of Instruments is the search for hotspots, measuring the impact of your optimization efforts can be a challenge of its own. In this article, we have discussed how and when Xcode’s UI-testing capabilities can be used to get comparable runs of your code in Instruments — a key factor in judging the quality of optimizations of non-obviously suboptimal code.
In addition, we have demonstrated how to pass data to the application under test in a way that is maintainable and requires little to no infrastructure.
When it comes to measuring how your code performs in real-world situations, nothing beats the insights you can gather from running Instruments: If I were to develop for any non-Apple platform, this program would probably be the tool I would miss the most.


