An Introduction to LLDB Reproducers

Reproducing a bug in a software system is often a difficult task because of the number of different configurations, operating systems, and timing conditions that can affect the end result of a program. And if the bug affects the debugger itself, reproducing it is even more difficult.
To help reproduce bugs, the LLDB project has launched an experimental feature, LLDB Reproducers. This article will explain what reproducers are and how they can be used from the Xcode IDE.
What Are LLDB Reproducers?
If you’re new to LLDB, the LLVM debugger, I recommend you read what we wrote about it in this blog post. Although it’s an introduction post, we also explored the extension capabilities of LLDB, which are a key feature of this debugger.
Reproducers are an experimental feature in LLDB to make bugs that affect the debugger easier to reproduce. Imagine you’re debugging a Swift program and you get a strange error message when you try to print the description of an object in the debugger. You decide to send a bug report to Apple with very detailed reproduction steps. Some months later, the bug report is closed with the status “cannot be reproduced.” Why is that? Did you miss mentioning something important? In most cases, what you missed mentioning is a key configuration change in your program or system. LLDB reproducers help developers include all program and system configuration settings in their bug reports, making bugs easier to reproduce and fix.
How Do LLDB Reproducers Work?
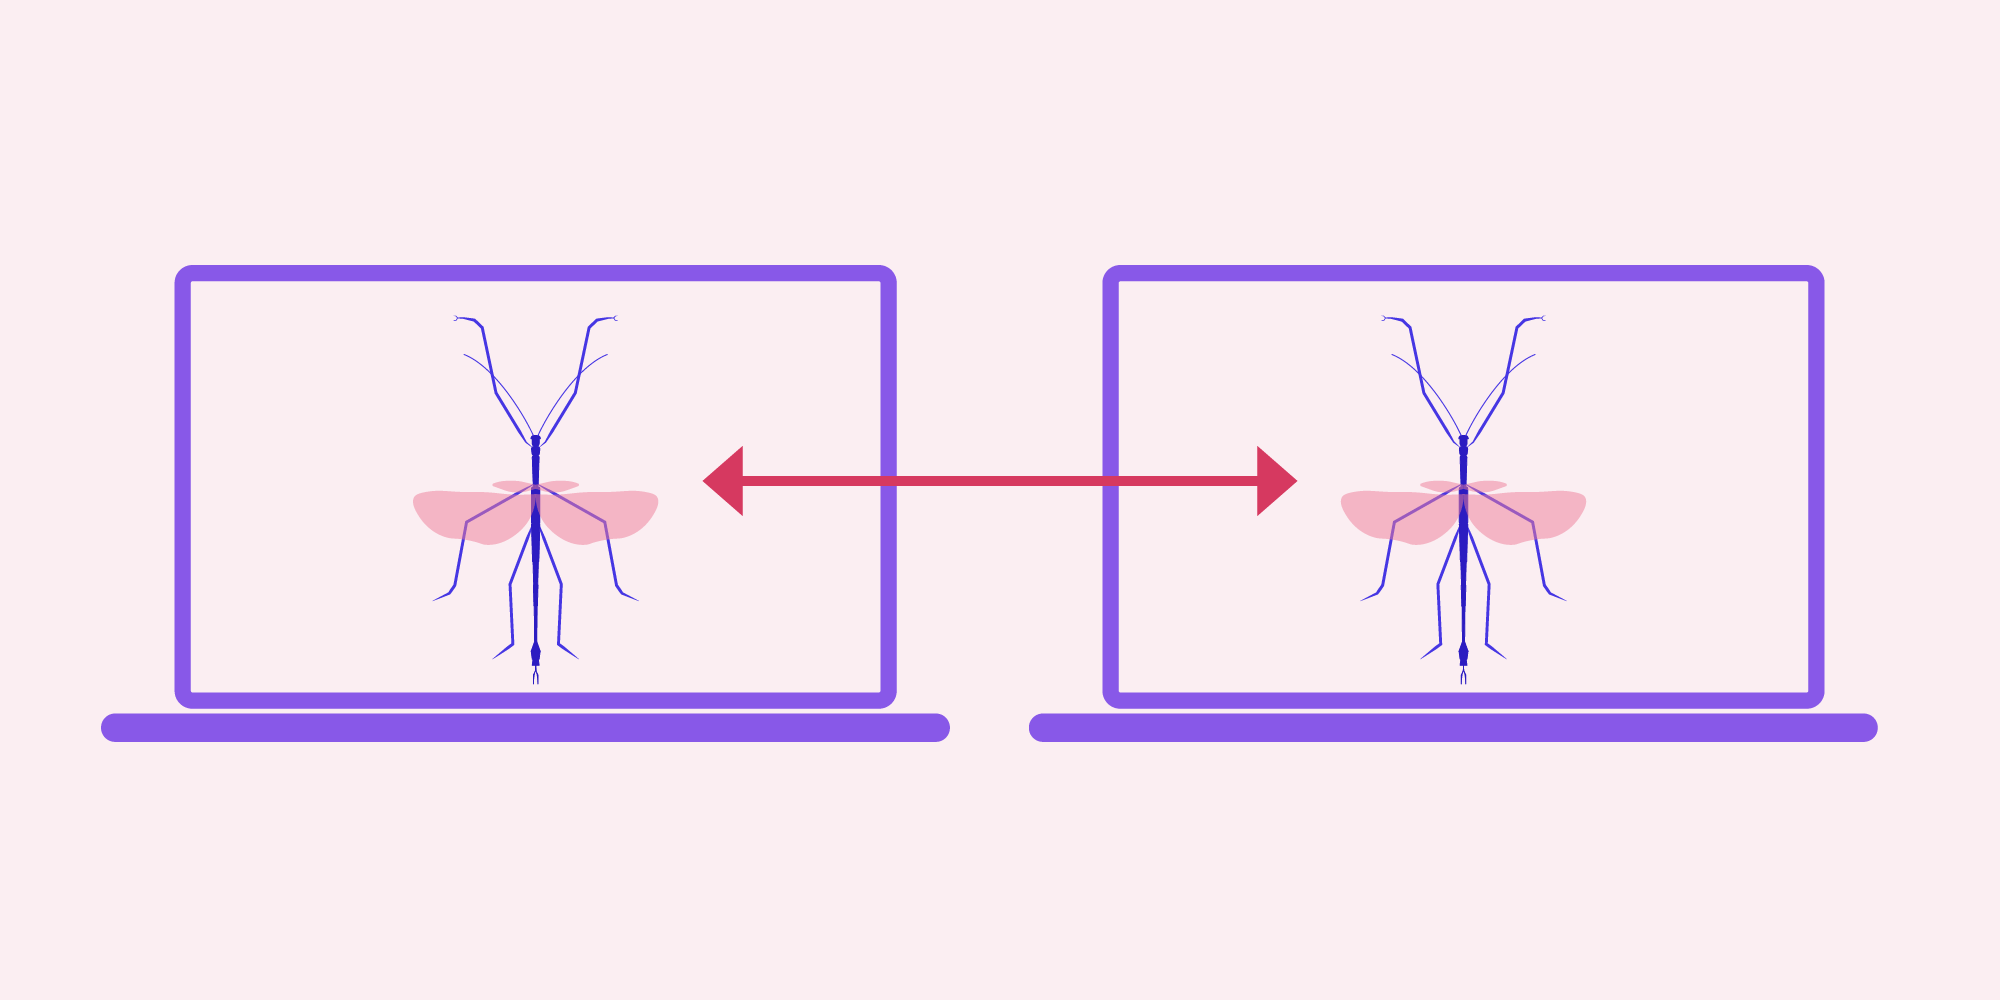
Now that I’ve covered the motivation for using LLDB reproducers, let’s describe how they work. Reproducers are integrated in any LLDB included in recent versions of the Xcode/LLVM toolchain. They have two modes of execution: a “capture” mode, where the debugger is configured to track all the relevant information during a debugging session; and a “replay” mode, where the information gathered from the capture mode is used to reproduce the problem at some point in the future, and maybe from a different computer.
How to Enable Capture Mode from the CLI
Imagine you have the following Swift source file, Sample.swift:
func foo() -> String {
    return "Foo"
}


func bar() -> String {
    return foo() + "bar"
}

let b = bar()
print("testing")
If you want to debug this simple program, the first step is to compile it with debug information:
swiftc -g Sample.swift -module-name main -o Sample.out
This will generate a Sample.out file that can be debugged with LLDB.
Let’s start LLDB in capture mode:
lldb --capture --capture-path Sample.repro Sample.out
The --capture flag starts LLDB in capture mode. All the captured information will be written to the file specified as the --capture-path parameter — in this case, it’s Sample.repro.
Once the LLDB REPL has started, you can begin debugging your program. Let’s simulate a simple debugging session.
Create a breakpoint in a particular line:
(lldb) b Sample.swift:2
Now run the program inside the debugger:
(lldb) r
LLDB will stop at line two of Sample.swift:
Target 0: (Sample.out) stopped.
Now let’s display a backtrace:
bt
And we’ll continue the execution of the program until it finishes:
c
Process 55172 resuming
testing
Process 55172 exited with status = 0 (0x00000000)
Let’s generate the reproducer capture:
reproducer generate

Reproducer written to '<Path>/Sample.repro'
Please have a look at the directory to assess if you're willing to share the contained information.
The capture package at Sample.repro contains the information necessary to recreate the debugging session. The next section will explain how to use LLDB replay mode to do this.
How to Enable Replay Mode from the CLI
To reproduce the debugging session we captured in the previous section, we need to invoke LLDB in replay mode:
lldb --replay Sample.repro
You’ll see that LLDB automatically reproduces the debugging session we captured before:
(lldb) target create "Sample.out"
Current executable set to '<Path>/Sample.out' (x86_64).
(lldb) b Sample.swift:2
Breakpoint 1: where = Sample.out`main.foo() -> Swift.String + 4 at Sample.swift:2:12, address = 0x0000000100000e74
(lldb) r
Process 55979 stopped
* thread #1, queue = 'com.apple.main-thread', stop reason = breakpoint 1.1
    frame #0: 0x0000000100000e74 Sample.out`foo() at Sample.swift:2:12
   1   	func foo() -> String {
-> 2   	    return "Foo"
   3   	}
   4
   5
   6   	func bar() -> String {
   7   	    return foo() + "bar"
Target 0: (Sample.out) stopped.

Process 55979 launched: '<Path>/Sample.out' (x86_64)
(lldb) bt
* thread #1, queue = 'com.apple.main-thread', stop reason = breakpoint 1.1
  * frame #0: 0x0000000100000e74 Sample.out`foo() at Sample.swift:2:12
    frame #1: 0x0000000100000e9d Sample.out`bar() at Sample.swift:7:12
    frame #2: 0x0000000100000db4 Sample.out`main at Sample.swift:10:9
    frame #3: 0x00007fff68ed0cc9 libdyld.dylib`start + 1
(lldb) cont
Process 55979 resuming
Process 55979 exited with status = 0 (0x00000000)
This is a simple debugging session, but you can use the same approach to capture more complex debugging scenarios. Note that LLDB reproducers are still an experimental feature, so there may be bugs in the feature itself. If you find any, file a bug report against the LLDB project.
Using LLDB Reproducers from Xcode
If you have a complex project that’s difficult to compile from the command line, you may want to use LLDB reproducers from Xcode, Apple’s IDE. Note that using LLDB reproducers from Xcode is an internal feature that may break at any moment, so use it with care.
First, close any instances of Xcode you may have open and create an empty AppleInternal folder in the /Applications/Xcode.app/Contents/Developer directory of your system.
Then, add a specific value to the Xcode defaults to enable this internal experimental feature:
defaults write com.apple.dt.Xcode IDEDebuggerEnableReproducerCapture -bool YES
Restart Xcode and debug your Swift project as usual. From the LLDB console, you can check that the reproducers feature is enabled by running the following LLDB command:
(lldb) reproducer status
Reproducer is in capture mode.
Path: /var/folders/kc/wy0fj1cx1454svg9fz5fclvh0000gp/T/reproducer-21dbfc
After the debugging session has finished, LLDB will write the debugging capture to the temporary folder shown in the output of the reproducer status command (in this case, /var/folders/kc/wy0fj1cx1454svg9fz5fclvh0000gp/T/reproducer-21dbfc). You can simply replay the capture from the command line by following the steps described in the previous section.
Conclusion
In this blog post, I described what the LLDB reproducers feature is and how it helps reproduce bugs in the LLDB debugger. The feature is experimental, but it’s already part of the latest Xcode toolchain. If you’re interested in improving this feature and its rough edges, feel free to contribute to the open source LLDB project.


