Debugging a specific instance with scripted breakpoints

When debugging an issue that is somewhere deep inside your code, you easily end up debugging a class that has lots of living instances. Sometimes, you are only interested in a very particular one. This can become very tedious work. You’ll find yourself verifying that you are looking at the right instance and, if not, continue as long as your breakpoint is hit by the instance you are actually interested in.
There are a couple of ways around that.
Setting multiple breakpoints
The easiest solution is to set two breakpoints. The one you are actually interested in, as well as another one that hits as close as possible before the other breakpoint and where it is easy to identify the instance you are looking for. You can then disable the breakpoint you are actually interested in and wait for the other breakpoint to be hit. Once this is the case, you enable the other breakpoint and continue until you hit this one.
This helps in a lot of cases, but there are a couple of issues. If you are dealing with an object that is used from multiple threads, the second breakpoint does not necessarily need to be hit by the same object as your first one. It could be one from another thread, and this could be different each time you do this. Another issue is that it sometimes is hard to find a spot for the first breakpoint that is so close to the other one that this method works reliably, even in single threaded environments.
Conditional breakpoints
So let’s make this better by setting a conditional breakpoint that ensures that the instance is the one we are looking for. The general set-up remains the same. We have a first breakpoint where we can ensure that we have the object we are looking for and this breakpoint needs to be hit before the breakpoint we are interested in.
This time we identify the object in the debugger and get the address by a simple command: p magazine in my case gives me the address of the object I am interested in:
(lldb) p magazine
(PSCMagazine *) $1 = 0x00007fe79b115460
Now we edit the breakpoint we are interested in and add a condition to it. Instead of my address, you add the one you got in the previous step, of course:

I tend to cast everything I put in a breakpoint’s condition. Even though it is obvious that this expression returns a BOOL, lldb has some hiccups with that from time to time. Remember to activate the breakpoint.
Now, whenever the debugger stops at this breakpoint, you can be sure that the object you are in (self) is the object you are looking for. This of course works with all other kind of conditions. You could, for example, check if the object you are looking for passed in to the method you set the breakpoint in, as a parameter. The condition is not much different from every other if you write in your code.
Automating this
When debugging an issue that requires you to do this dozens of times, this manual copying can get annoying. So why not automate this? This is actually pretty easy, the only downside is, that Xcode’s UI doesn’t help us a lot here and you will no longer see the second breakpoint (the one you are interested in) in the list of breakpoints in Xcode. Xcode and lldb will, however, stop at the breakpoint the same way you are used to it.
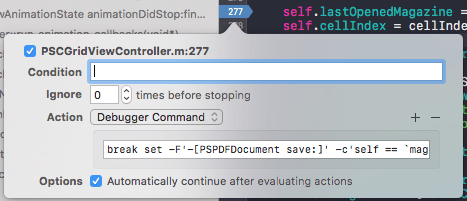
To achieve that, we remove the second breakpoint and instead edit the first breakpoint. Xcode has the option to add an action to a breakpoint. These actions can be things like playing a sound, logging a message, and also executing a debugger command. This is what we are interested in. By clicking the Add Action button and choose Debugger Command from the list of actions, we achieve that Xcode will execute the command we type in there as soon as the breakpoint is hit. The command we need looks like this:
break set -F'<MethodName>' -c'<condition>'
In my example it looks like this:
break set -F'-[PSPDFDocument save:]' -c'self == `magazine`'
The important part here is to put the variable you previously typed in the debugger in back-ticks. That tells lldb to evaluate the variable right away and put the result of that in the condition. The last thing we set is the Automatically continue after evaluating actions option. This means that the debugger does not stop at this breakpoint, which is exactly what we want. We are not interested in this breakpoint. It is just a hook to set up the breakpoint we actually want to stop in.
Now, every time this breakpoint is hit, it creates a breakpoint like the one we created manually in the previous step but it automatically fills in the correct condition.
You could even use similar actions to get rid of the old breakpoints at that location, if you need to make sure that only the latest breakpoint is active.
I have this condition in my list of tools so that I can just copy that over when I need it. You may not need it very often, but if you do, it saves you a lot of annoying copy and pasting work. Using this method when debugging rotation issues would probably have saved me quite some time.